Intro
Ben reported problems with the sband pulsar
observing on 13oct22. He mentioned that is had been occurring
for awhile.
He provided plots of the problem
pulsar
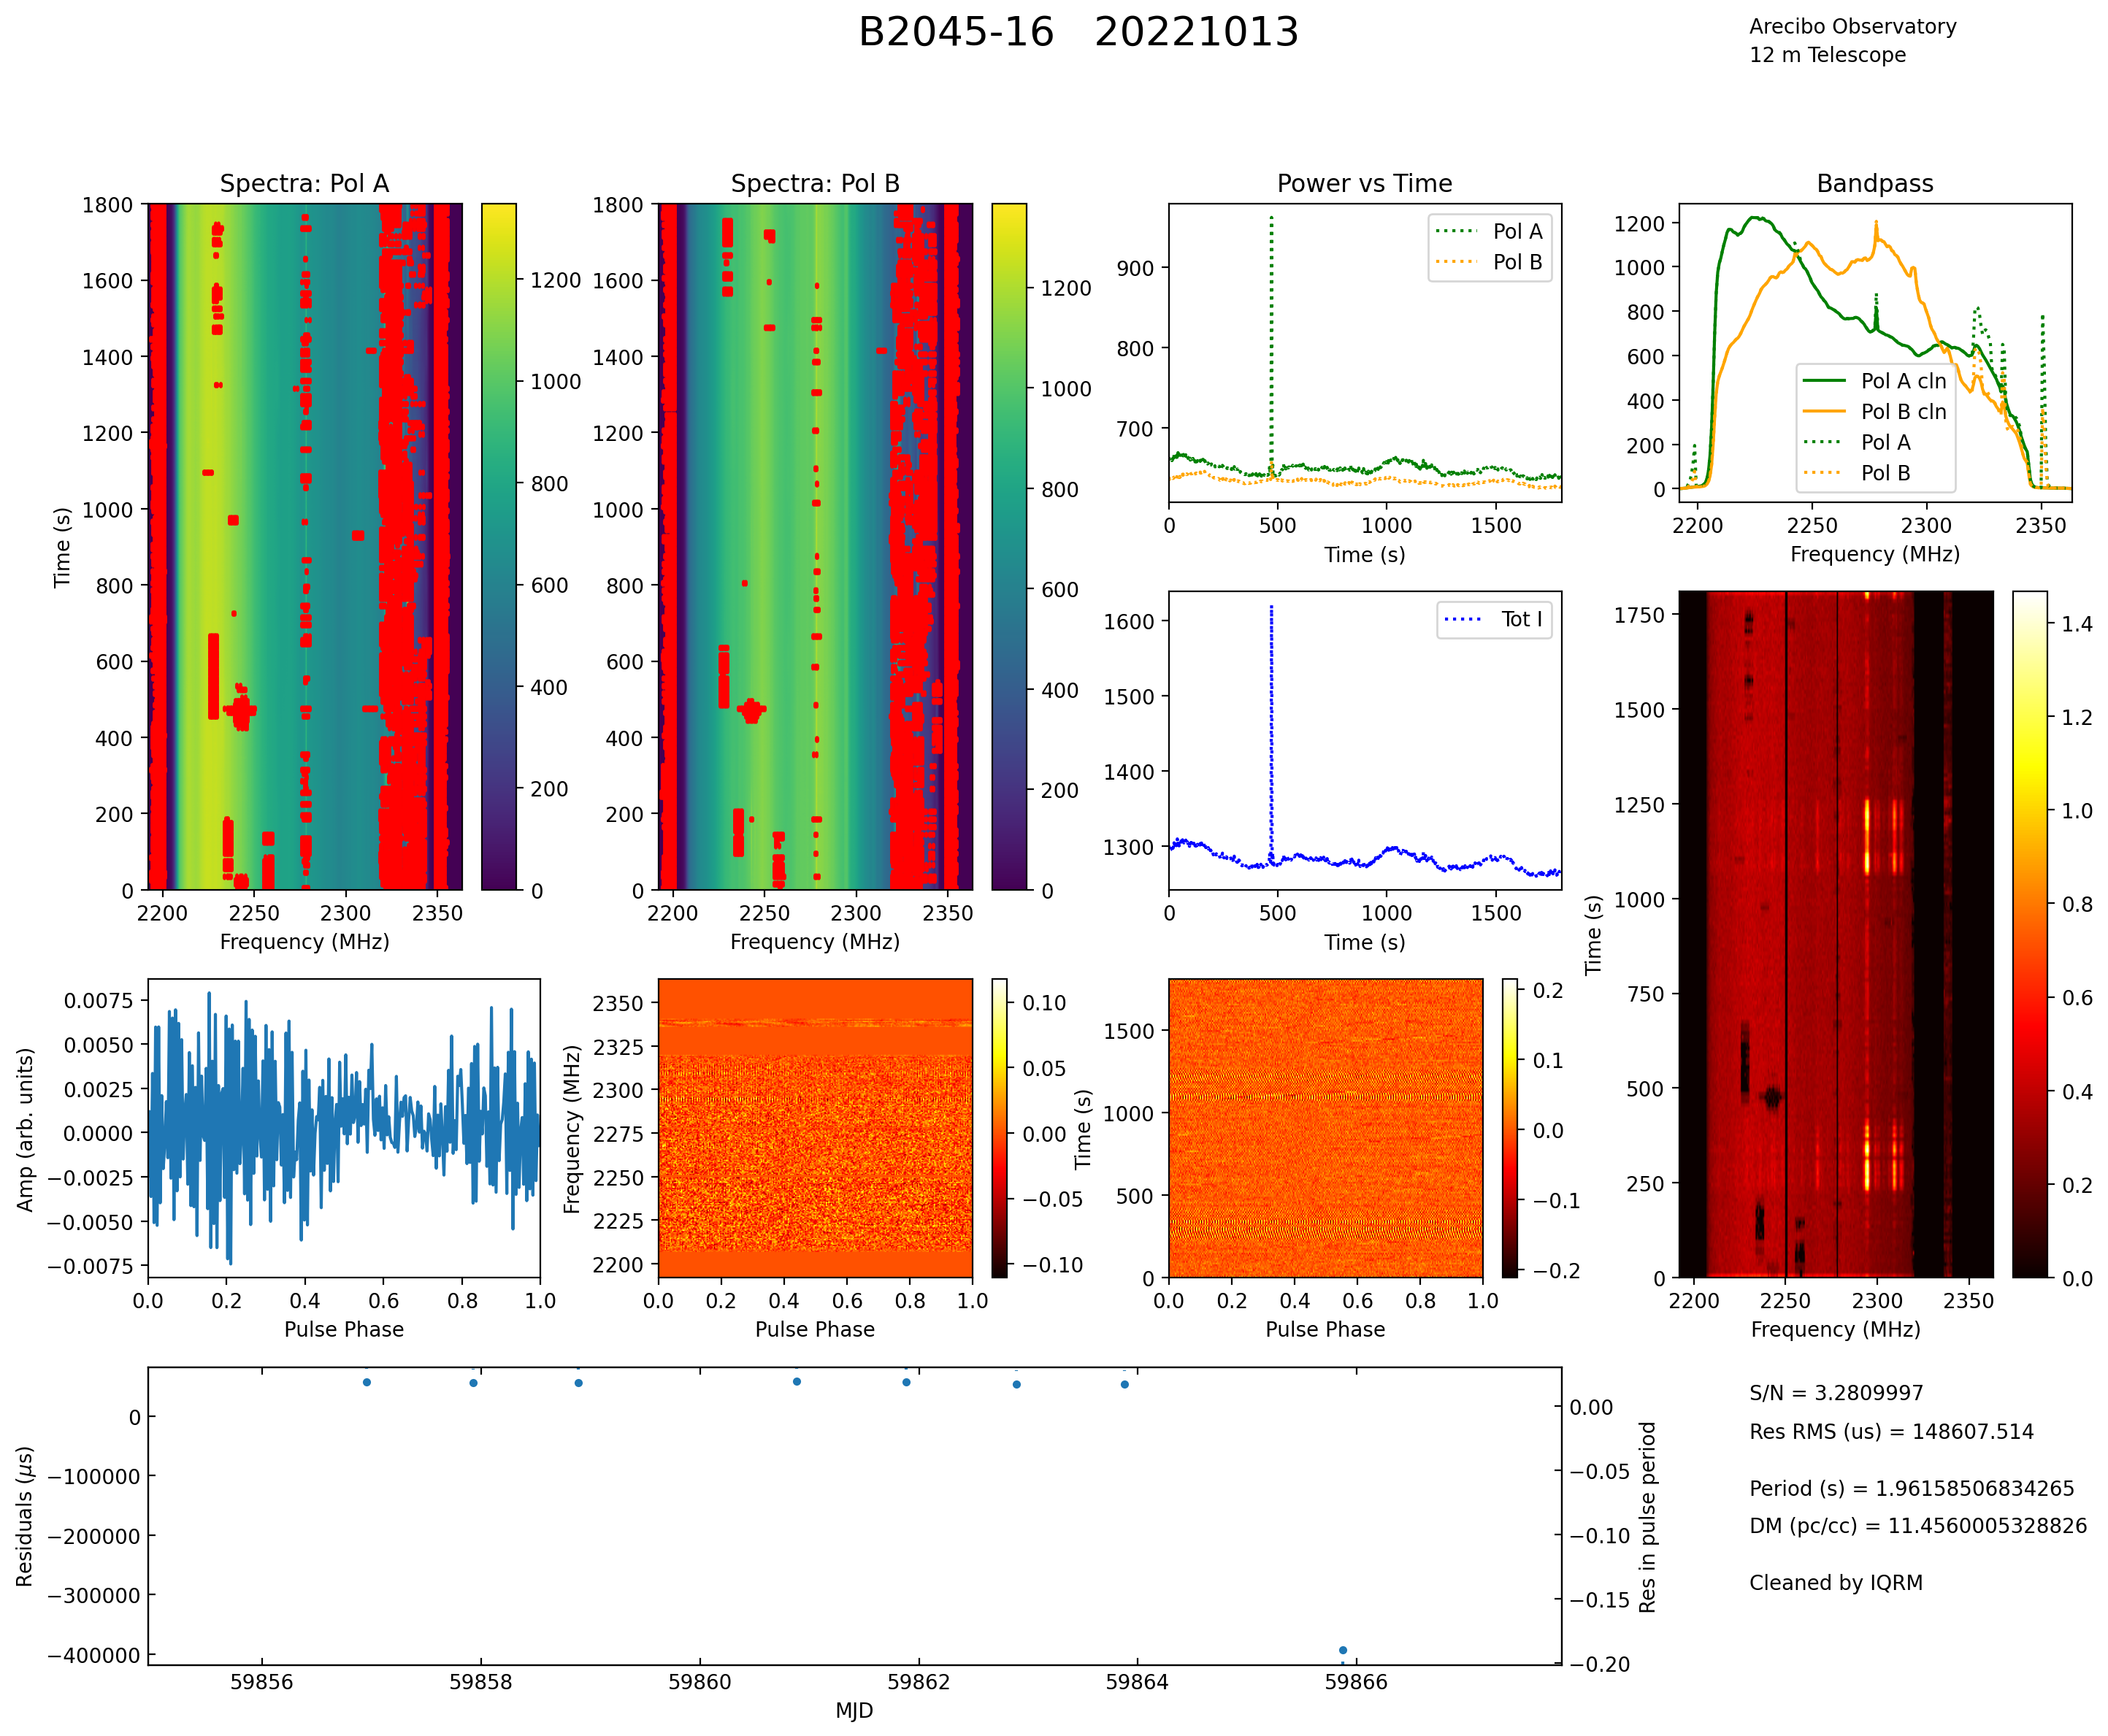
processed data 221013 B2045-16 (.png)
The problem is seen in the pulse phase vs time dynamic spectra..
250 to 300 secs and 1000 to 1200 secs.
&$
What data was examined
- The pulsar data taken 13oct22 on B2045-156
- pulsar data taken aug,sept,oct22 looking at the first row
(second) of data for each source
- 19oct22:
- more data was taken using 2 mock boxes to see if
the problem was 1 single mock box.
- 21oct22: spectrum analyzer at input to post
amp chassis checked to see if the 60 Hz was present
there.
- 26oct22: an az swing was done to see if the 60Hz had
an azimuth dependence (external rfi source)
Setup:
- The receiver was set to a center frequency of 2278 MHz
- A single mock spectrometer was used to record the data
- 171.032 MHz
- .0005 sec spectra integration
- 256 freq channels.
- The 19oct22 data used 2 mock boxes with the same signal
set setup.
13oct22 B2045-16 data
- The file sspsr.20221013.B2045-16.b0s1g0.00100.fits was
used.
- this is the first file after the cal
- az=123, el=32.
- 1 row of data was used
- 1 second of data, 2000 .0005 sec spectra
- Dynamic spectra of the 2000 spectra for polA and B were
made.
- The average spectra for 1 second for polA and polB was
computed
- the rms/mean by channels was done for the 2000 spectra
- total power vs time was computed for:
- a freq region around the 60 Hz tp rfi
- a region away from the 60Hz tp rfi
- The total power was then computed for the 2 freq regions.
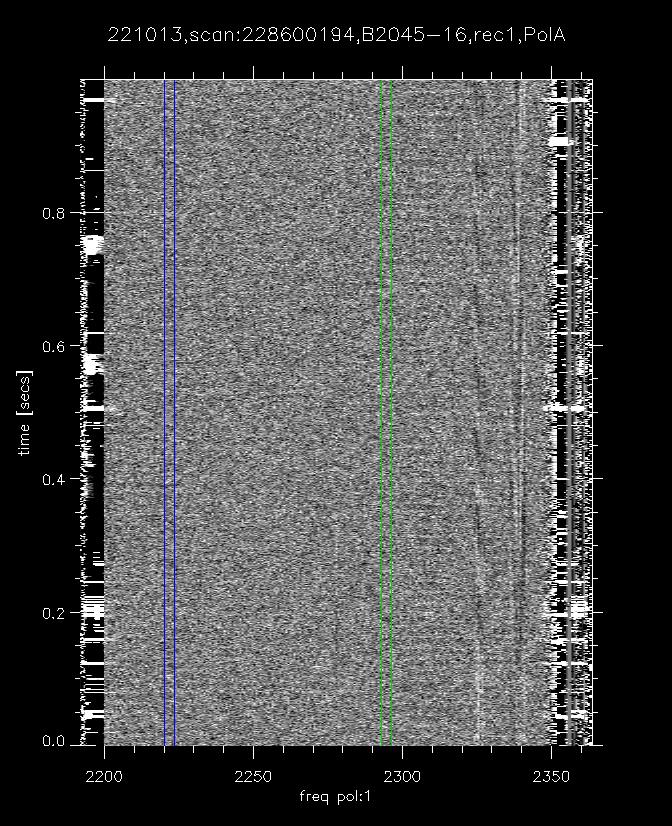
The Dynamic spectra
PolA
dynamic spectra (.jpeg)
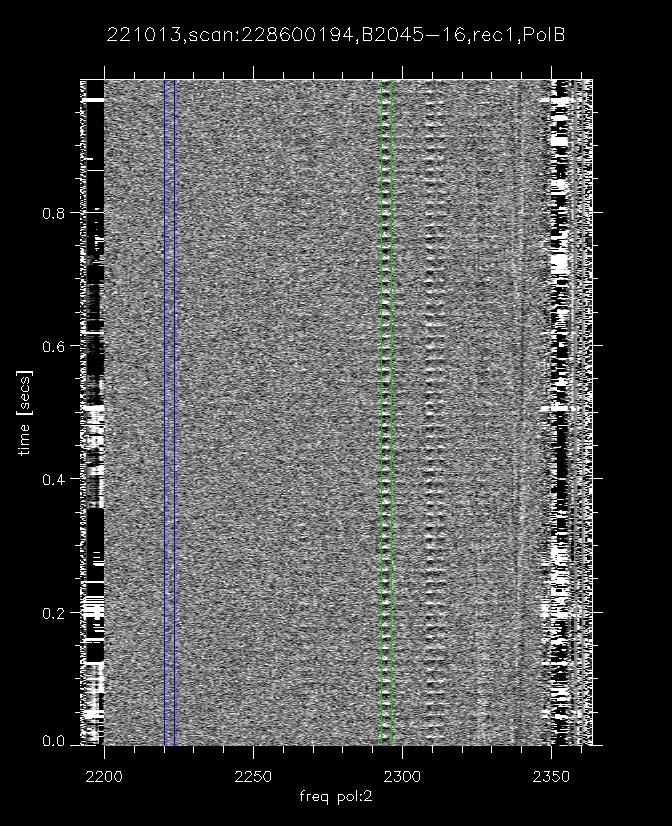
PolB
dynamic spectra (.jpeg)
- There are 2000 .0005 sec spectra in each image
- to fit in the display the 2000 .0005 sec spectra
were avg to 2000/3 =.0015 sec s
- 256 freq channels across 172.032 MHz (67Khz rbw)
- two freq regions were selected:
- 2220 to 2223.4 MHz. blue lines, no rfi
- 2292.8 to 2296.3 MHz. green lines with rfi
- This rfi is strong in polB
- There is also rfi at 2310 MHz with the same time
variation.
- this is seen in polA and polB.
Line plots of spectra, rms , and total power
The line plots show spectra and total power vs time
(.ps) (.pdf)
- Page 1: spectra, rms/mean and total power
- top frame: 1 second average spectra.
- black: polA, red: polB
- The blue and green lines show the two freq regions
used for total power.
- 2nd Frame: rms/mean by freq channel.
- This was computed using the 2000 .0005 spectra.
- Black: polA
- red: polB
- blue,green: freq ranges without, with rfi.
- green range 2292.8 to 2296.3 :
- PolB shows large rms/mean
- PolA is clear.
- 3rd Frame: total power vs time from green region
- black is polA, red is polB
- The total power is computed between 2298.8 to 2296.3
(green range)
- the data was normalized to the average value.
- PolB had a large oscillation, polA doesn't
- only .5 seconds of data is plotted.
- bottom frame: total power vs time for blue region
- 2220to 2223.4 MHz
- you don't see any periodicity in this freq
range.
- Page 2: mag of total power spectra.
- the magnitude of the total power time series was
computed for each of the 2 freq ranges:
- spc=abs(fft(tp -mean(tp)))
- Top: total power spectra using total power freq range
2292.8-2296.3
- Pol B has a large 60 Hz with harmonics
- pol A does not show 60Hz.
- bottom: total power spectra using total power freq range
2220-2223.4 MHz
- there is a little 60 Hz in polA, nothing in polB
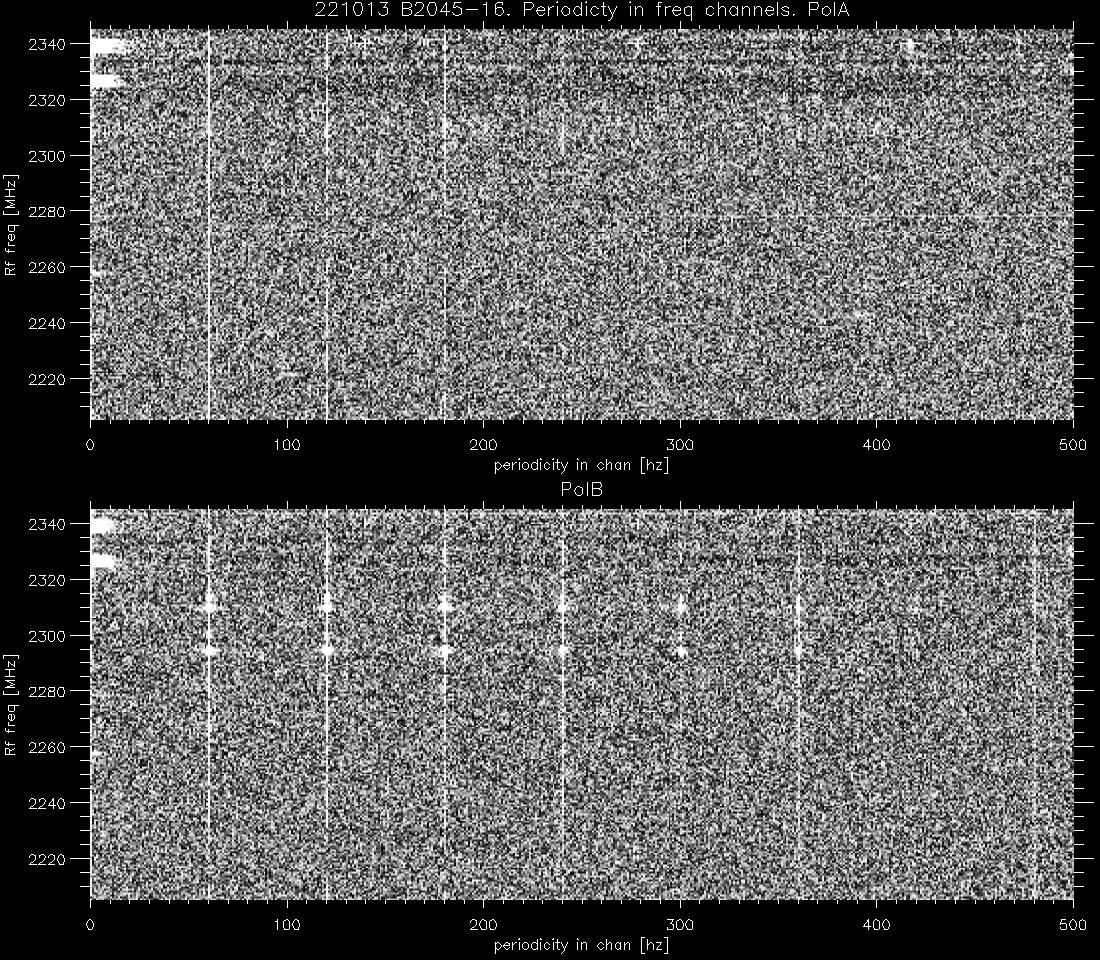
total power periodicity vs rf frequency channel
The periodicity within each spectral
channel was examined by:
- input a row of spectra (2000 spectra of 256 freq
channels and .5 millisecs integration).
- compute the fft of length 2000 for each of the 256 freq
channels (abs(fft(spcchan))
- normalize each channel by its median value first
(bandpass correction).
- keep 500 Hz (of the 1000 Hz total)
- Repeat this for 100 rows (100 secs) averaging the total
power spectra.
the image shows the periodicity by rf
frequency channel (.jpeg)
- The vertical axis is the rf frequency channels
- the horizontal axis is the total power freq for that
channel
- Top frame: polA
- vertical lines at 60Hz and harmonics out to about 240 Hz
- there may be a stronger point at 2310 MHz
- bottom frame: polB
- solid vertical lines across all freq at 60Hz multiples
out the 480 Hz
- above 240 Hz the are harmonics of 120Hz, not 60Hz.
- there are large points at
- 2395MHz
- 2310 MHz
- 2312 MHz
- these are not seen on polA
processing: 221013/cmpperiod.pro
Summary 221013 data
- narrow periodic signals are seen in 2292.8 to 2296.3 MHz
and also near 2310 MHz
- The periodicity is 60 Hz:
- polA,B have broad band 60Hz and harmonics (stronger in
polB)
- polB has strong harmonics of 60Hz
- around 2395,2310 and 2312 MHz.
- A 60Hz modulation at the a/d input would give a 120Hz
modulation in the power (from squaring the voltage to get
power).
- The narrow band strong 60Hz harmonics are not coming
from the a/d converter
- There is some 120 Hz harmonics in polB.
- If the IF was being modulated with 60 Hz, then you
wouldn't expect it to only show up in a few narrow frequency
bands.
- What ben saw in his pulsar plots:
- The period of the pulsar is 1.962 milliseconds and has a
dm of 11.45
- The dm delay across the band is about 1 millisecond
each period.
- The pulse phase vs time image shows bright lines at:
- 250 secs to 350secs
- 1100 secs to 1250 secs.
- the red freq vs time rms by channel plot shows that
these times correspond to larger variation around 2395 MHz
- --> this is where we are seeing the 60Hz.
- the coming and going of the problem in pulse phase vs
time may be from the 60 Hz beating with the pulsar period
and dm correction.
processing: x101/221013/rfi60Hz.pro
When did the 60hz modulation problem
start?
Ben mentioned that he has seen this type
of problem for awhile.
I went through all of the 12meter pulsar data aug through
15oct22:
- Find all of the sources observed each day.
- input the first record of each of these sources (skipping
the cal file)
- this gives 1second of data , 256 freq channels, and
spectra sampling of .1 to .5 milliseconds.
- Compute the rms/mean by freq channel.
- make an image using all of the rms/mean spectra for
a month.
- since there were different integration times for
different sources:
- i removed the median value from each rms/mean spectra.
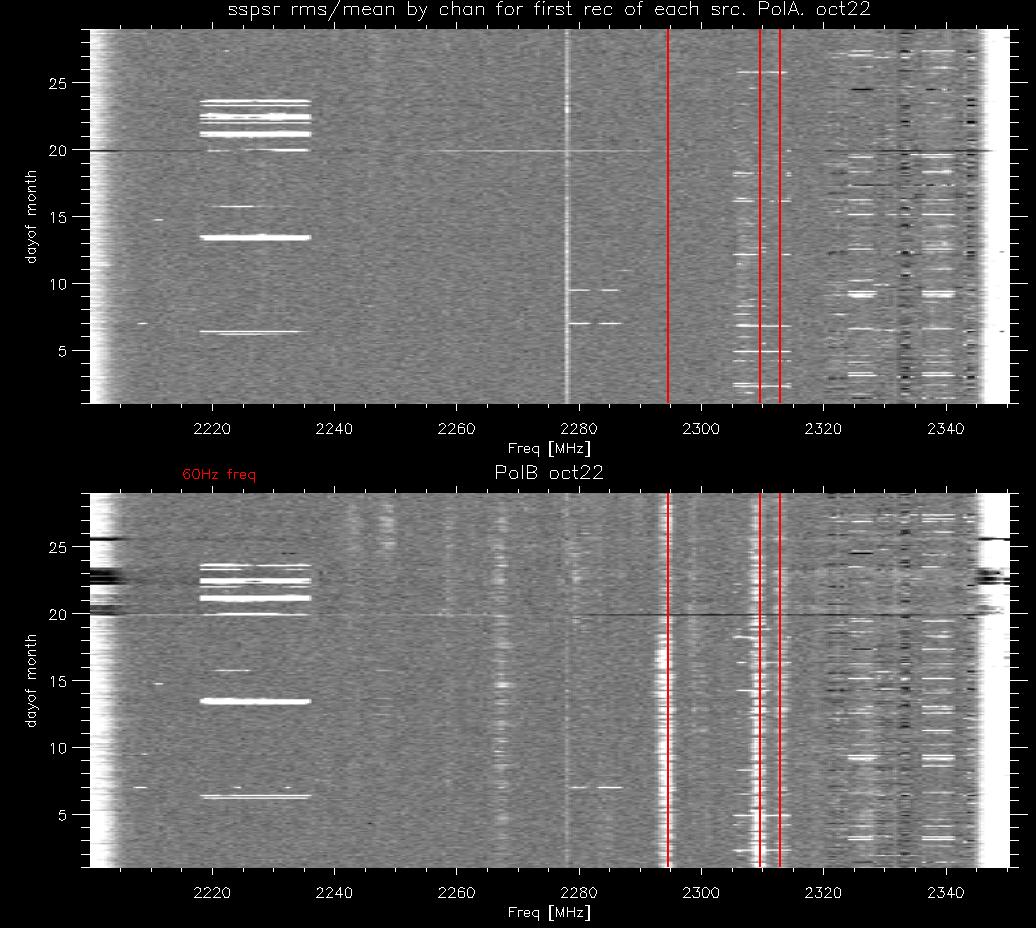
- The red lines flag where we've seen the strongest 60 hz
modulation (in oct22)
- This has mainly been in polB
- Occasionally there are weaker signals in other freq
channels.
- They may have shifted in freq a bit as you go earlier in
time.
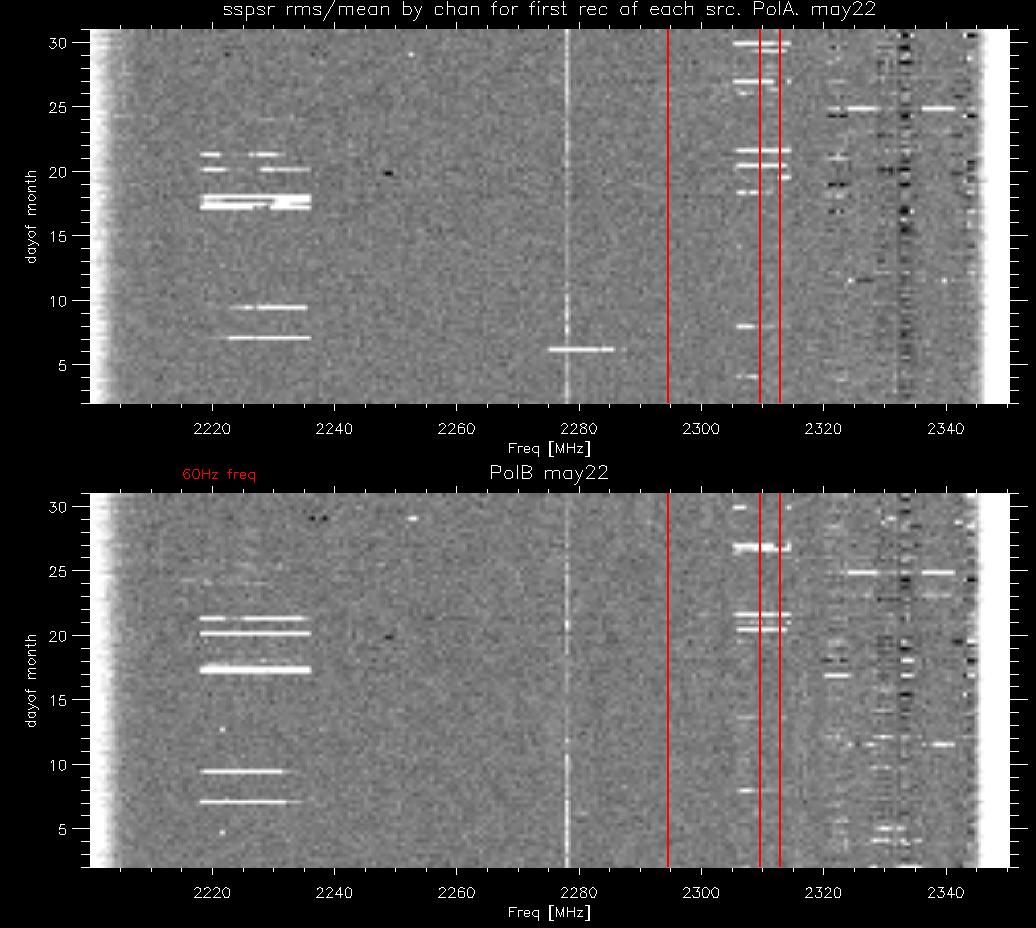
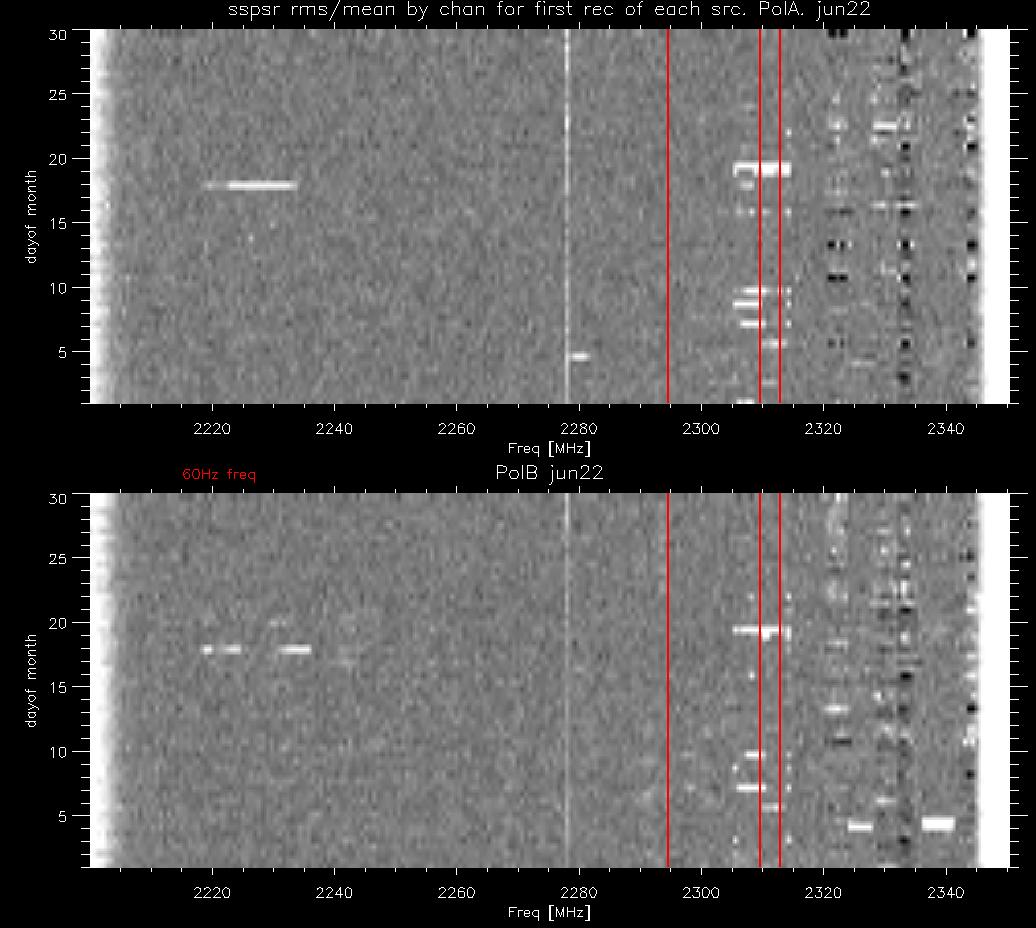
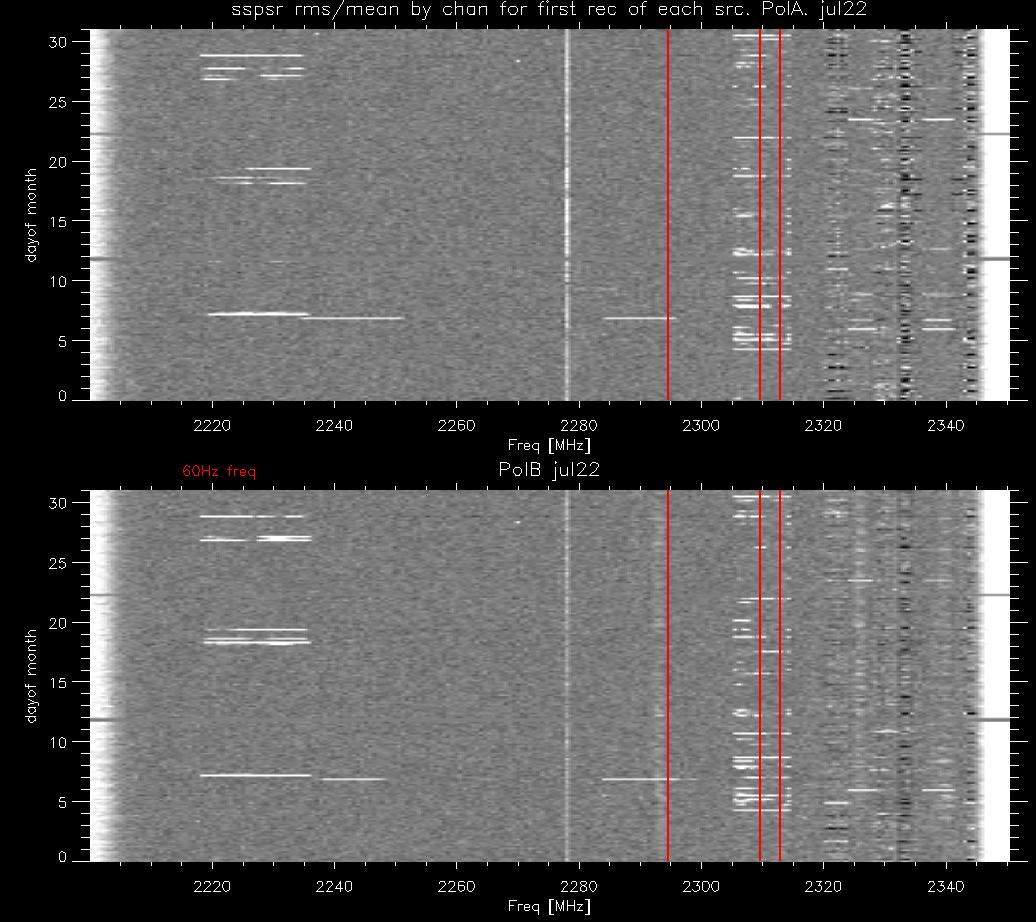
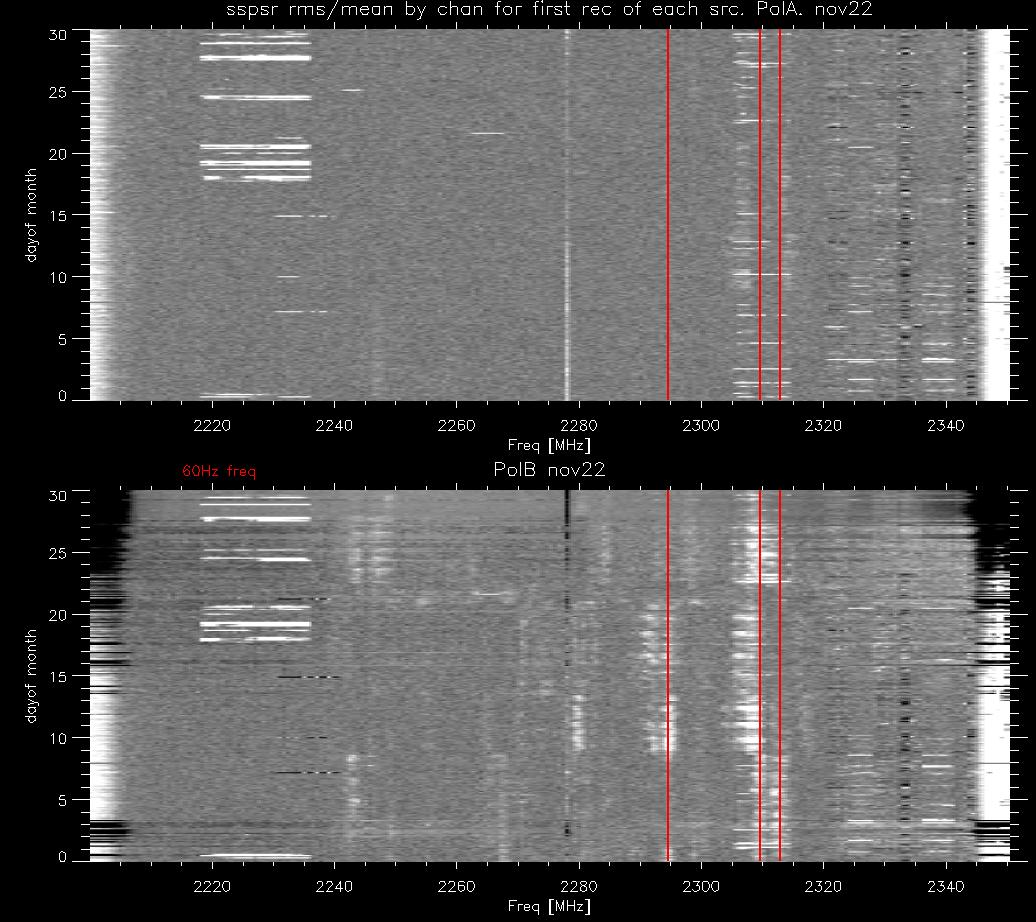
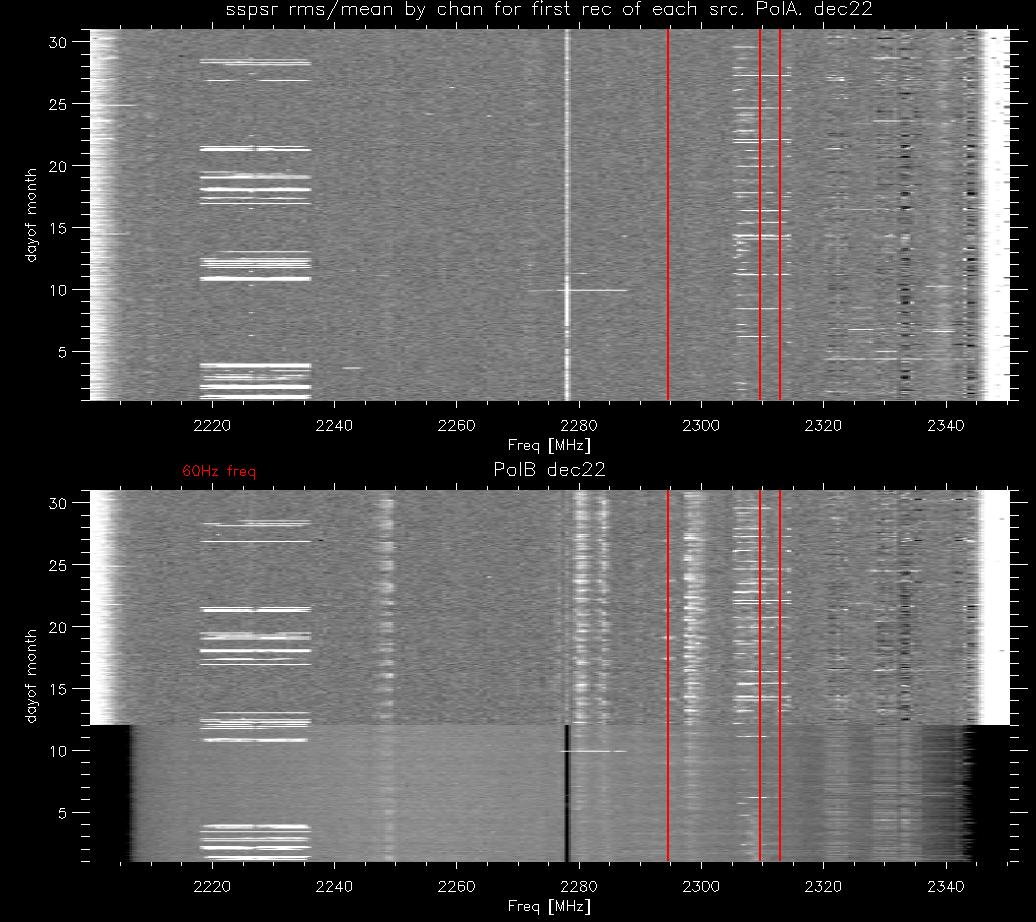
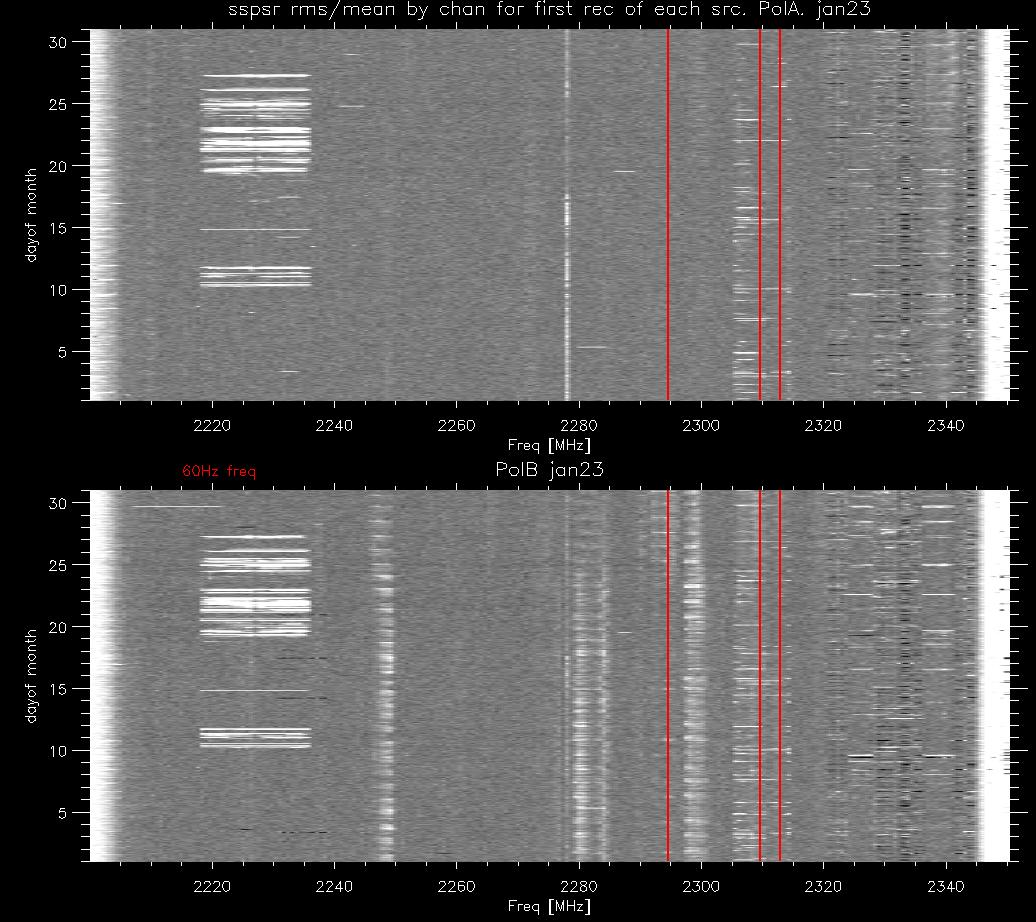
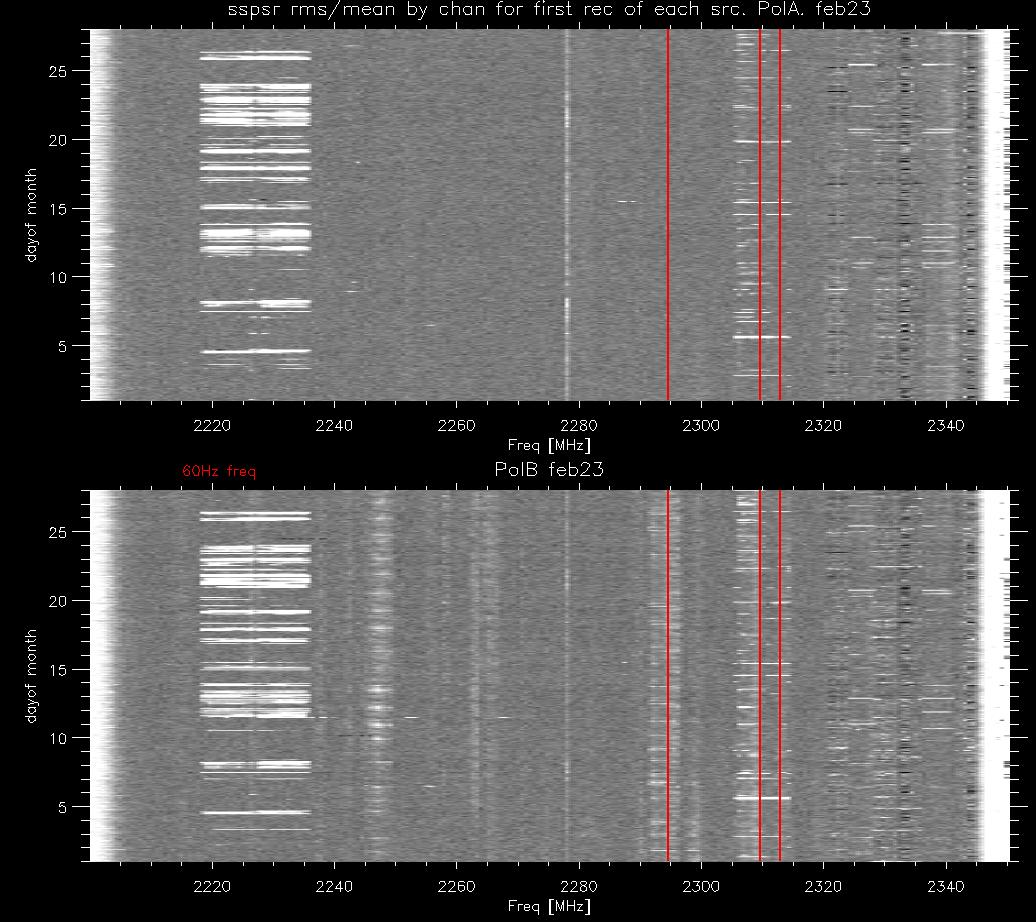
The table below shows the images for each
month:
- For each image:
- top frame: polA
- bottom frame: polB
- Yaxis is the day of month (approximately since there are
a different number of sources/day)
- The red lines show the frequencies where we saw signals
with strong 60hz modulation (during oct22)
- PolA
- there is no strong variation at the red flagged freqs
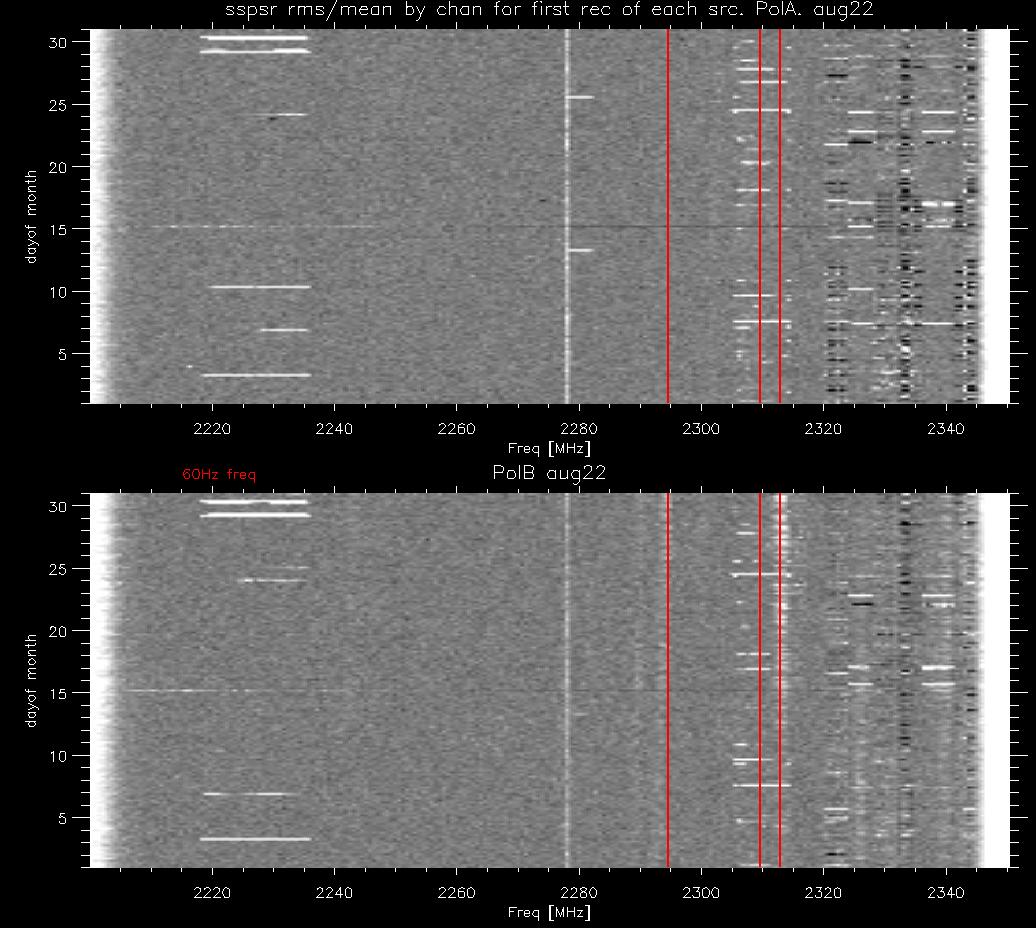
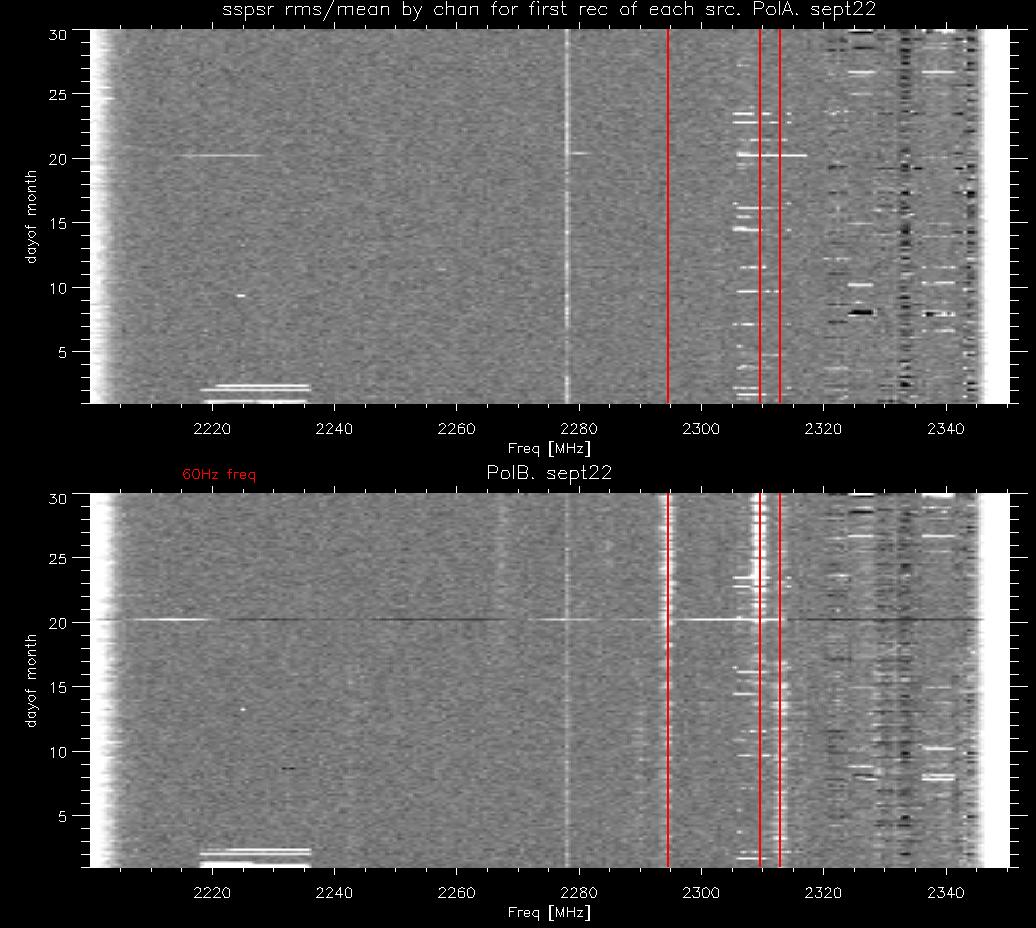
- PolB:
- jul22: weak signal at 2295.
- aug22:
- starts to get stronger around 15aug22 (at 2312MHz)
- sep22:
- gets stronger after 20 sep22
- oct22:
- Nov22:
- 9nov22 the cal box was removed and brought down to the
lab
- 10nov22 reinstalled
- 2310 60hz birdie jumped to about 2308.
processing: 221013/chkrms.pro
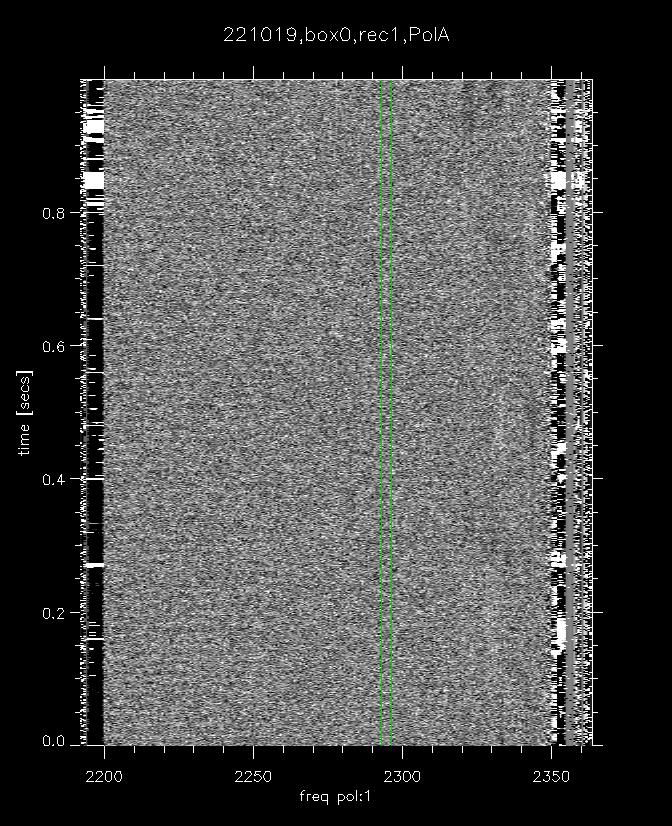
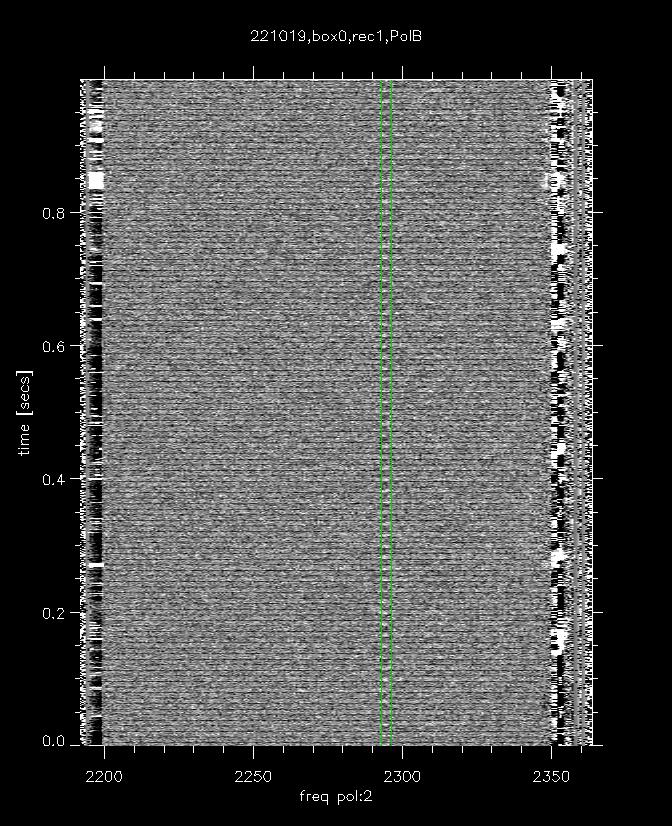
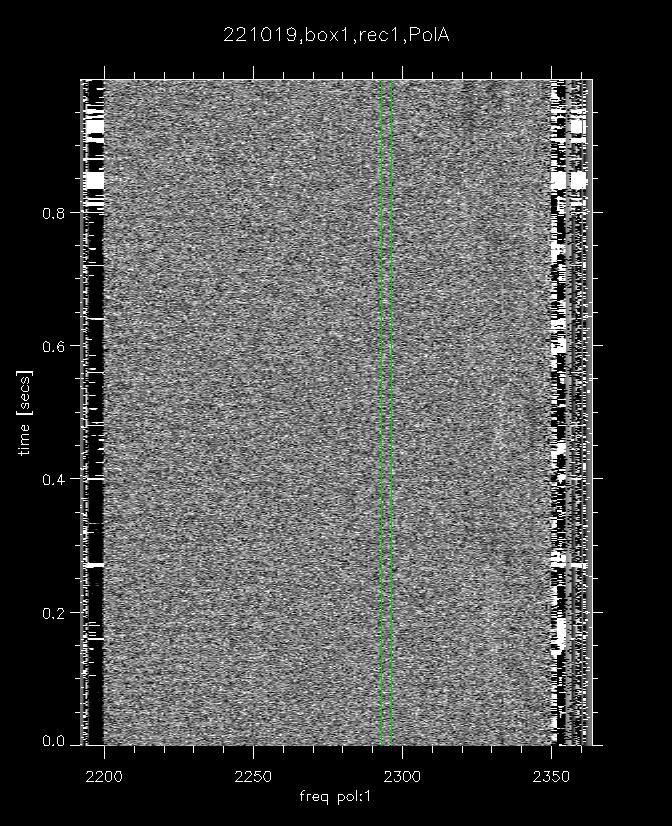
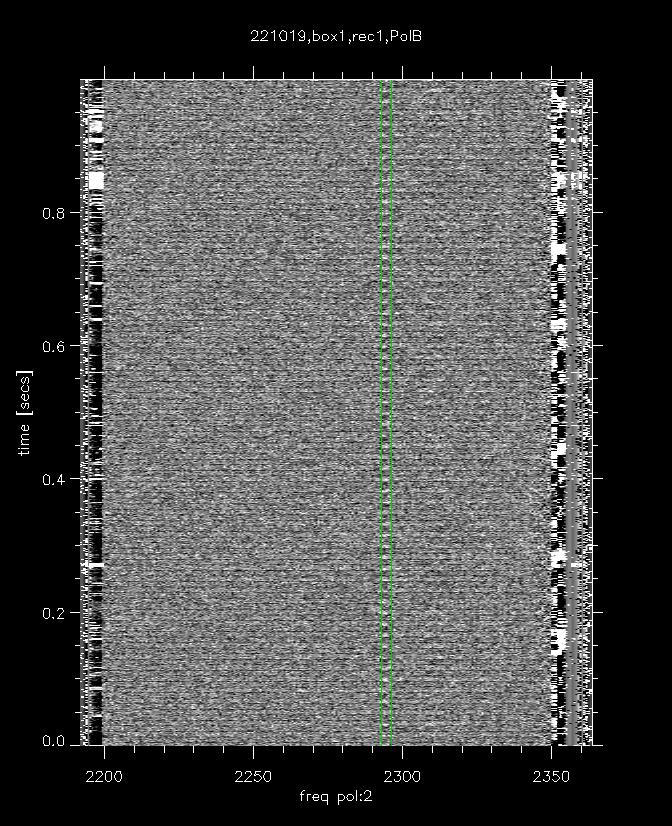
19oct22 look at multiple mock boxes.
On 19oct22 identical data was taken with 2
mock boxes to see if the problem was present in both.
- 256 freq channels,172.032 MHz bw, .5 millisecond spectra
sampling, 2000 spec/row (1 second)
- The telescope was stopped and the sky drifted through the
beam.
- data was taken bm/box 0 and bm/box 1 of the mocks.
Dynamic spectra were made with the first record for each
data set
- PolA
- PolB:
- 2395 and 2310 60 Hz present
- there are narrow black horizontal lines. The system if
probably going into saturation at 60 HZ rate.
We then plotted the rms/mean by freq chan
for the first rec of each data set (.ps) (.pdf)
- Black is box 0
- Red is box 1
- green is the expected rms/mean from the radiometer
equation.
- Top: rms/mean by freq channel box 1,2 polA
- Box 0,1 have identical rms/means. The black spike
at 2278 is probably the dc channel.
- there is nothing extra at 2295 MHz
- Bottom: rms/mean by freq channel box 1,2 polB
- Both show added rms around 2395MHz
- Box 0 level is higher than the box1 level
- The dark horizontal lines on polB box0 looked stronger
that those in box 1.
- These will increase the rms/mean by channel.
- The lines are probably caused by the band being in
saturation. The 60 Hz spikes push the entire band
further into saturation (causing the black lines).
processing:x101/221013/221019_box12.pro
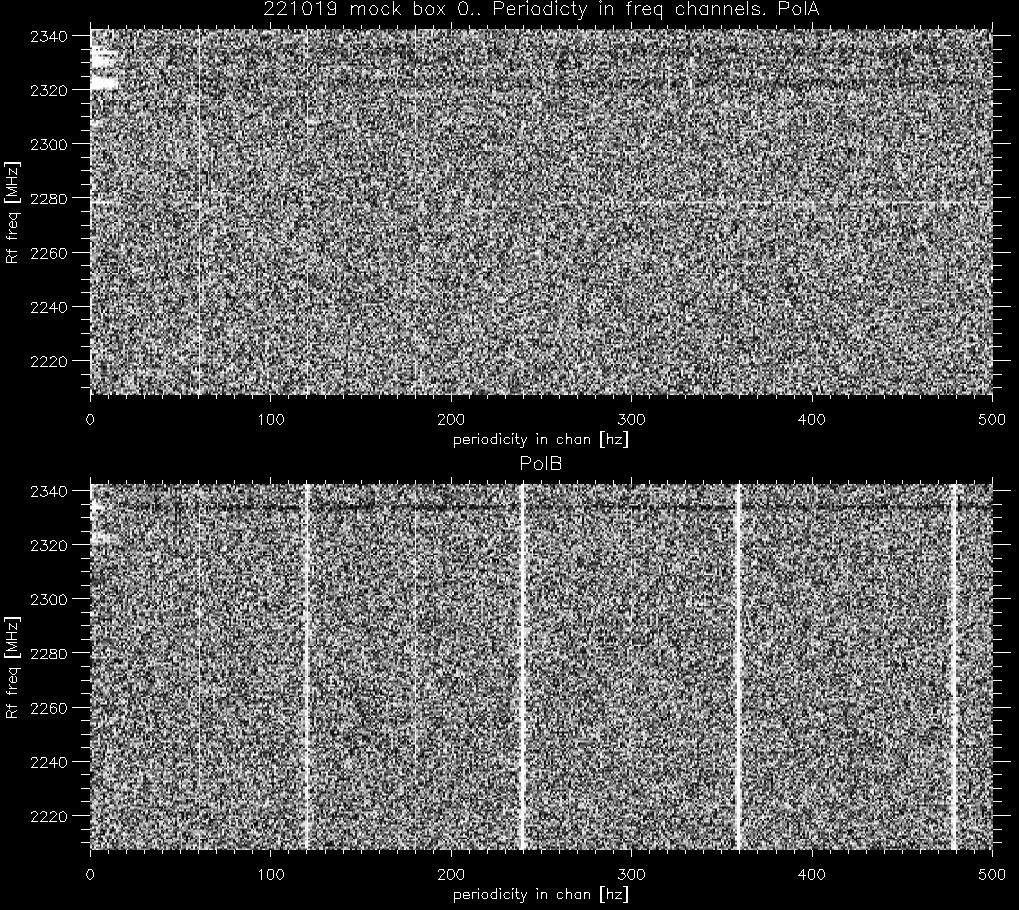
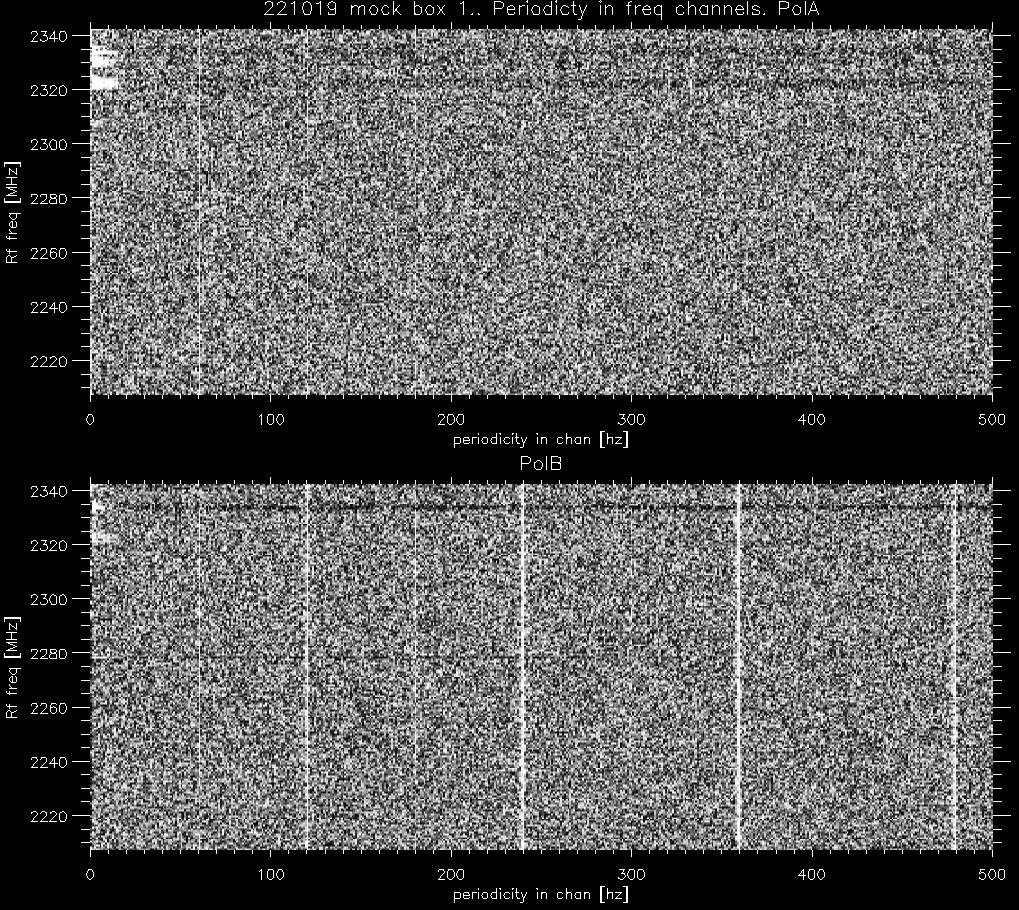
Time variation along the spectral channels.
The periodicity along each each spectral
was computed by:
- For 1 second of data
- compute abs(fft(spc[i,*])) for i=0,255 of the
spectral channels.
- with .5millisec spectral dumps, this give 2000
spectra, and 1000Hz periodicity bw.
- Repeat this for the 30 seconds of data, averaging the 30
results.
- Box0:
- polA: broad band 60Hz and maybe a little 120Hz
- polB: broad band 60 Hz. strong harmonics of 120Hz
- Box1: Similar to box 0..
- but the 120Hz harmonics are not quite as strong.
The images do not give a good idea of relative strengths
(since i clipped the image at N*Sigma to see weak things).
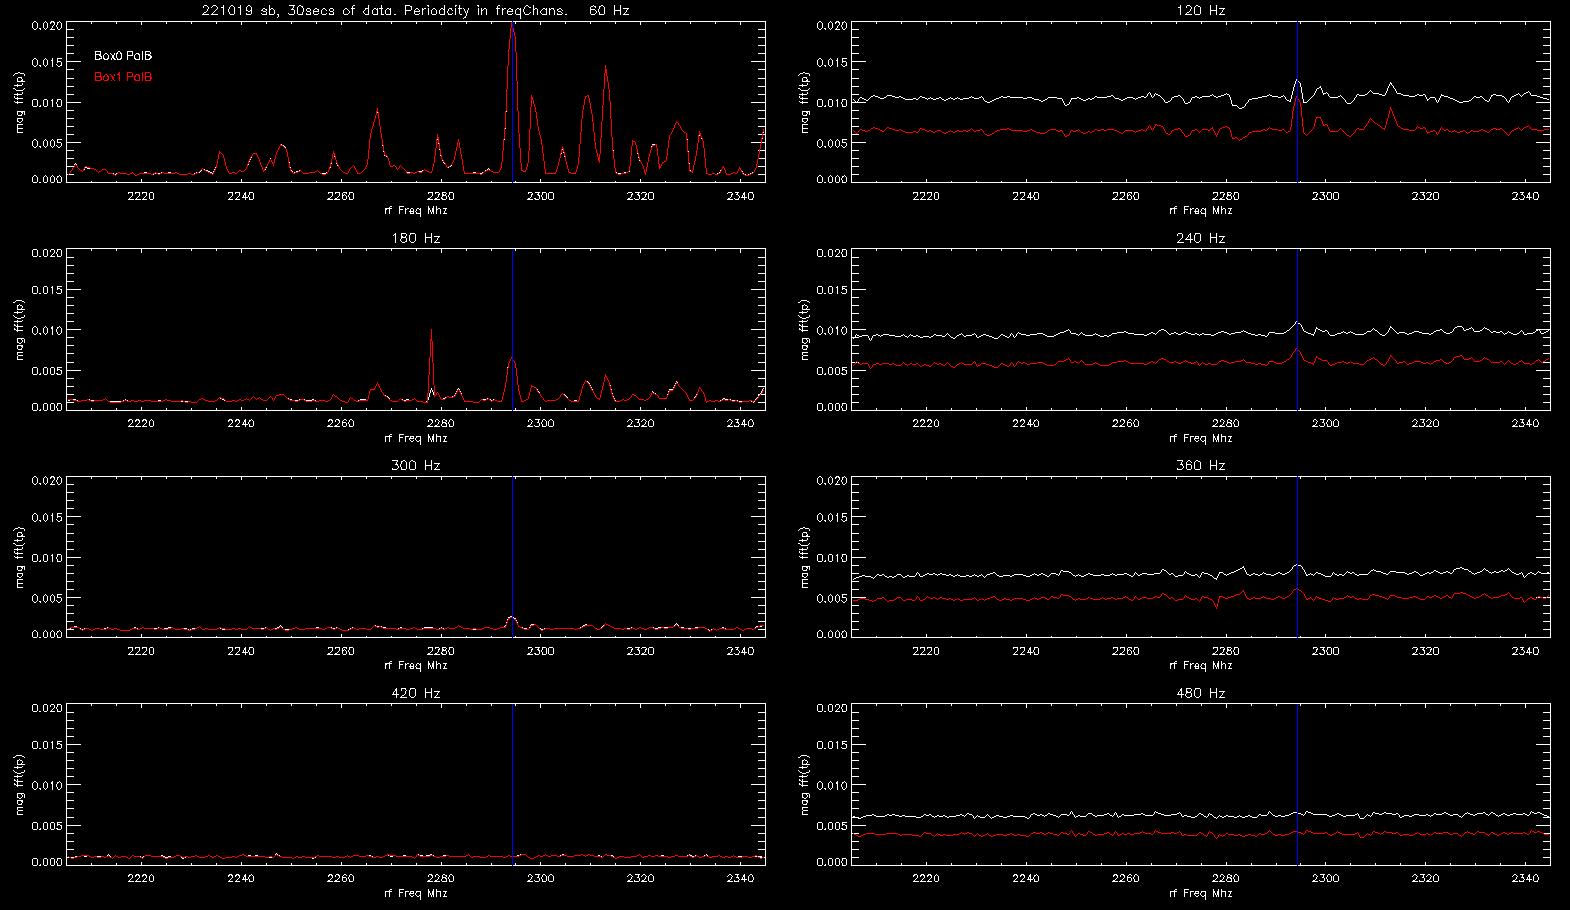
I then made plots of the 60Hz
harmonics seen in time (.jpeg)
- I only included polB in the plots.
- White is box0
- Red in box1
- The left col has odd harmonics: 60,180,300,420 Hz
- These show the strong 60Hz at 22956 MHz
- Box0, box1 plots are identical
- This is not coming from the mock box a/d's
- The right col has even harmonics: 120,240,360,480 Hz
- These include harmonics from 2295MHz
- and the two box levels are not the same.
- The difference is probably from 60 Hz at the
digitizers.
- when the voltage is squared to get spectral density
you end up with multiples of 120Hz.
processing:x101/221013/box12_60Hz.pro
Summary 221019 data:
- The variation in spectral channel power at 2295 MHz is
common to multiple mock boxes.
- It is a multiple of 60 Hz.
- it is not a 60 Hz problem in the mock digitizers.
- there is a broad band 120 Hz that shows up in the
different boxes with different strengths
- this is 60Hz at the digitizer being squared when power
is computed.
- the 19oct22 data showed some broad band 60Hz
compression.
- this implies that the band is running close to
compression.
- The mock spectrometer monitors overflows in the a/d,
pfb, and accumulators.
- there was no overflows recorded in polA,B box0 and
box1.
- so any compression is occurring prior to the mock
spectrometer.
- When a 60 Hz signal is added at 2295 MHz then we will
see more compression across the band.
- This compression is probably a function of the direction
we are pointing the telescope.
- We may not be able to see what is causing this
compression if it is outside the rf filter we
have after the lna and postamp amps.
total
power spectra for the 2295MHz channel (.ps) (.pdf)
221021: Look at input to post amp chassis.
On 21oct22 we looked to see if the 60 Hz
total power oscillation at 2295 MHz occurred before the
postamp chassis (and rf filter).
The setup was:
- Field fox spectrum analyzer used:
- cfr:2295 MHz
- rbw:1MHz
- zero span
- postamp on, attn=0, 1001 points, sweep time .5 seconds.
- The PolB signal that goes into the postamp chassis was
connected to the field fox.
- this is before the rf filter
Processing the data:
- With a sweep time of .5 secs and 1001 points, the sample
rate was: .0004995 secs (2khz).
- We ended up with 1001 total power samples : tp(t)
- the totalPwrSpc= abs(fft(tp(t)/mean(tp(t))))
The plot shows the total power spectra for the
2295MHz channel (.ps) (.pdf)
- The vertical axis a fractions of mean power in 2295MHz
channel.
- the red dashed lines are multiples of 60 Hz.
- the fundamental (60 Hz) is about 2% of the average power
in the channel.
Summary 221021:
- The 60Hz at 2295MHz occurs before the postamp
chassis.
processing:/x101/221021/sbrfi.pro
221026: azimuth swing
On 26oct22 an azimuth swing was done to see
if the 60 Hz had an azimuth dependence.
The setup:
- telescope motion:
- az: -100 to 280 at 1 deg/sec CW then CCW
- el: 30 deg (fixed)
- data acquistion
- cfr: 2270
- mock: 172.032 MHz bw, 1024 channels, 1millisecond
sampling, aofits recording
Processing:
- The CW file was input
- A dynamic spectra was made using the first 1 second of
data (1ms spectral sampling)
- The total power was computed using 2MHz about
2294.48,2308.94 for every 1ms spectral sample
- the total power spectral magnitude (abs(fft(tp)) was
computed using these 2 tp bands for every 1 second of data
(1000 samples)
- The 60 Hz component of the total power spectra was
extracted and then plotted vs azimuth to see if there was
any variation.
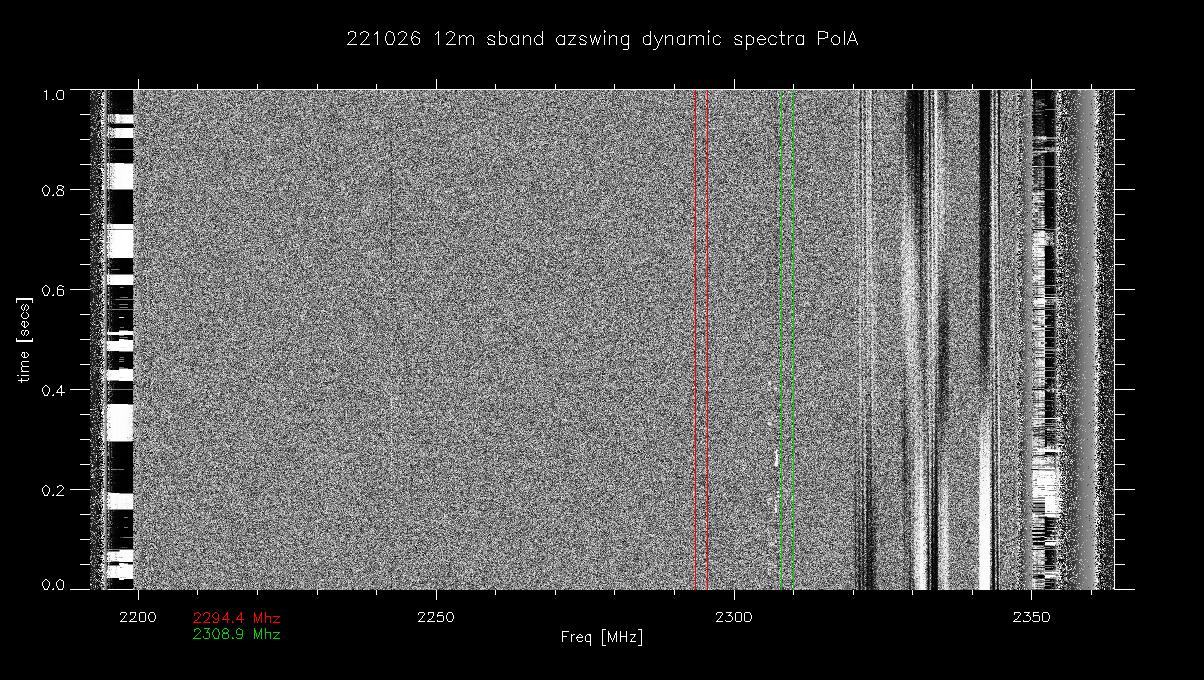
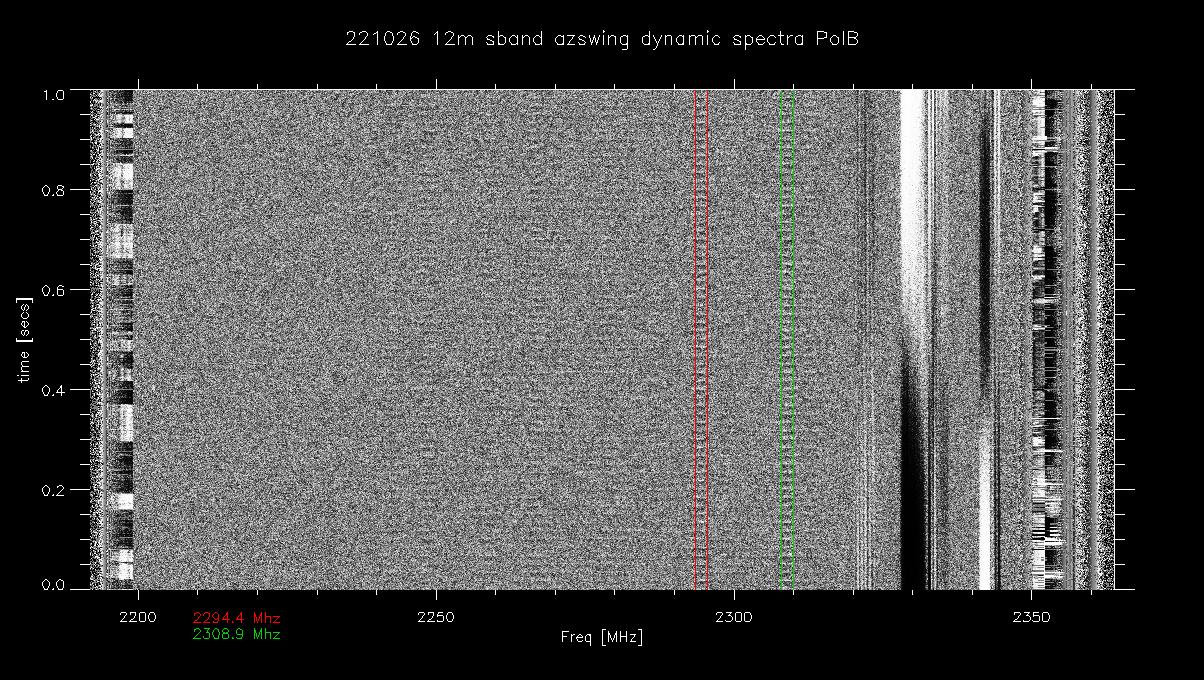
the data:
Dynamic spectra images were made
using the first 1 minute of data.
- Pol A shows little 60Hz
- Pol B shows 60Hz at 2294.4 (red lines) and 2308.9 (green
lines)
- Weaker lines are seen at lower frequencies.
- The total power was then computed for each 1 millisecond
spectra using the 2MHz inside the colored lines.
The plots show the total power in these two
frequency bands (.ps) (.pdf)
- Page 1 : total power vs time for the first second of data.
- Black is polA, red is PolB
- I've added a display offset of +/-.1 to polA and
B
- top: 2294.4 MHz Channel
- bottom: 2308.9 MHz channel
- You can see the 60 Hz in polb
- Page 2: overplot the 1 second total power spectra of
the two channels
- top: 2294.4 channel polA
- 2nd: 2294.4 channel polB
- 3rd: 2308.9 channel polA
- 4th: 2308.9 channel polB
- You can see the strong 60Hz in the pol B total pwr
spectra of both freq channels.
- Page 3: 60Hz spectal amplitude vs azimuth
- The amplitude of the 60 Hz peak is plotted vs azimuth
- Black: 60Hz channel polA
- red : 60Hz channel polB
- green: 59Hz channel polB (for comparison).
- Top:2294.4 MHz channel
- bottom: 2308.9 MHz channel
- This shows that there is no azimuth dependence of the
60Hz polB signal
- So the 60Hz is coming locally from the 12meter (power
supply or maybe pedestal).
processing:x101/221026/azswing.pro
Data from
221104
showed a 60hz plus 120Hz saturation in polB when the fiber
buffer box in the 12meter pedestal was unplugged.
On 221109 6 tests were done to see if the cal Box
was causing the 60/120 hz problem.
The setup was:
- sband receiver, center freq 2278Mhz
- mock spectrometer:
- 1 box, 172.032 Mhz, 1024 freq channels, 1ms spectral
dumps
- The telescope position:
- file 100,200: az=95.1, el=42.7
- file 300,400: az=313.1,el=5.6 (felix was in the hub at
the cal box)
- file 500,600: az=313.1, el=32.4
- The cal Box includes a peltier cooler. It is located close
the to lna amps in the 12meter hub.
- The fiber buffer box in the 12meter pedestal takes
the cal on/off fiber from the control room, boosts it, and
the send it up to the calbox in the hub.
- Turning the ac power of this box off on 04-06nov22
caused strong 120hz saturation in polB.
The 6 tests were:
file
|
dynamic spectra
(.gif)
|
TpVsTime and
Tp spectra
|
Setup
|
PolB
60Hz
Ampl
%tsys
|
PolB
120Hz
Ampl
%Tsys
|
| 100 |
PolA PolB
|
.ps
.pdf |
All on. This is the normal config for
12meter observing
|
.25
|
.5
|
| 200 |
PolA
PolB
|
.ps
.pdf |
FiberBufBoxAcOff
|
.25
|
.95
|
| 300 |
PolA PolB
|
.ps
.pdf |
FiberBufBoxAcOff, calBoxAcOff
|
0
|
0
|
| 400 |
PolA
PolB
|
.ps
.pdf |
FiberBufBoxAcOff, calBoxAcOn, cable
calBox to coupler unplugged(polb) |
0
|
0
|
| 500 |
PolA PolB
|
.ps
.pdf |
FiberBufBoxAcOff, calBox in lab
|
.35
|
0
|
| 600 |
PolA
PolB
|
.ps
.pdf |
repeat 500
|
.35
|
0
|
Notes:
- The dynamic spectra were made from the 1st 1 second of
data (each scan was 10 to 20 seconds of data)
- the Total power vs time plotted the 1st .1 seconds of data
- the total power spectra was computed for each 1 second
record and then averaged.
- So the 1 second image does not include all of the data
in the total power spectra.
09nov22 summary
- With everything on, there was 120hz saturation
- turning off the fiber buffer box increased the 120hz
amplitude by a factor of 2.
- there was a 4 Mhz wide 60Hz oscillation around 2310. It
was also seen at other freq (buf weaker)
- turning off the cal box caused all of the narrow band
60hz oscillations to go away).
- turning on the cal box but disconnecting the cable from
calBox to polB coupler, the narrow band 60hz rfi was still
not there.
- When the cal box was removed, the narrow band 60hz
came back.
- Turning off the calbox ac caused the 120hz to go away.
- The 120hz saturation did not return after that.
- We brought the cal box down to the lab and looked at it
with the spectrum analyzer. We didn't see any strong birdies
coming from the box output.
processing: x101/221109/chkcalbox.pro
221110: reinstall calbox, test for
120hz saturation
After the 09nov22 tests, the cal box was
removed from the telescope and brought to the lab to see if it
was genearating any unwanted signals (none were seen to the
limit of our sensitivity in the lab).
The calbox was reinstalled on the telescope
10nov22 and further testing was done.
The setup was:
- sband receiver, center freq 2278Mhz
- mock spectrometer:
- 1 box, 172.032 Mhz, 1024 freq channels, 1ms spectral
dumps
- Each test/scan lasted for 10 seconds.
- The telescope position:
- az = 313.86 for all tests
- el =
- file 000:56.82,
- file 100-500=5.6 (felix in hub)
- file 600-800 =24.7:
The 9 tests were:
file
|
dynamic spectra
(.gif)
|
TpVsTime and
Tp spectra
|
Setup
|
PolB
60Hz
Ampl
%tsys
|
PolB
120Hz
Ampl
%Tsys
|
| 000 |
PolA PolB
|
.ps
.pdf |
all Off, CalBox out.
|
.35
|
0
|
| 100 |
PolA PolB
|
.ps
.pdf |
calFibBoxAcOff, calBoxInAcOn
|
0
|
.35
|
| 200 |
PolA PolB
|
.ps
.pdf |
calFibBufAcOff, calBoxAcOn,reverse cal
cables at couplers
|
0
|
.8
|
| 300 |
PolA PolB
|
.ps
.pdf |
calFibBufAcOff, cal cables normal order
at couplers
|
0
|
.95
|
| 400 |
PolA PolB
|
.ps
.pdf |
calFibBufAcOn, cal cables normal
|
0
|
1.2
|
| 500 |
PolA PolB
|
.ps
.pdf |
CalFibBufAcOn, cal cables normal, switch
bias cables'
|
0
|
1.45
|
| 600 |
PolA PolB
|
.ps
.pdf |
Bias cables back to normal (same as
file 400)
|
.3
|
0
|
| 700 |
PolA PolB
|
.ps
.pdf |
All on,normal. Cal on
|
.3
|
0
|
| 800 |
PolA PolB
|
.ps
.pdf |
All on,normal. Cal off
|
.3
|
.9
|
Notes:
- The dynamic spectra were made from the 1st 1 second of
data (each scan was 10 seconds of data)
- the Total power vs time plotted the 1st .1 seconds of data
- the total power spectra was computed for each 1 second
record and then averaged.
- So the 1 second image does not include all of the data
in the total power spectra.
221110 Summary
- We saw some large 120hz saturation values.
- Generating the 120hz was not repeatable.
- file 400,600 the same but 120hz saturation was 1.2% and
0%
- between these 2, we switched the bias cables and then
put them back. and the telescope was moves 5.6 to 24 deg
elevation.
- file 600,800. all things back to normal 120hz
saturation 0 ,.9%
- Between these 2 scans, we did one scan with the calOn.
No cables were touched. and all we did was take a scan
with the cal On.
-
Summary:
- 13oct22 - pulsar problem with sband observing occurs when
the 60Hz at 2294 and 2309 mhz is strongest.
- The 60Hz is confined to a number of narrow rf
frequency bands (2294.4,2308.9) with an extent of
about 2 MHz.
- Looking at aug-oct data the problem started around the
middle of aug
- It is strongest in polB
- It is not from the AtoD (since 60Hz voltage would give
120Hz in power)
- We looked and saw the 60 Hz before the post amp chassis.
- Doing an azimuth spin showed now azimuth dependence in the
strength of the 60Hz at the rfi channels
- this shows that the signal is coming from the 12meter
(power supply or pedestal). It is not coming from
and intermod/harmonic of an external transmitter.
- Turning off the fiber buffer box (in the pedestal) caused
the 120Hz to get strong 4nov22, and file200 of
09nov22.
- We took the cal box down to the lab and we did not see any
irregular emissions coming from it.
- the data from 221110 showed that the 120Hz saturation was
not always repeatable.
- we used config A
- moved to config B
- retrurned to config A and and the results of configA
were different than the first time.