A2415 430 MHz mapping aug09
Last updated:22feb11
image of fields mapped to 22feb11
26oct10: links to images removed till jun11 when data becomes
public.
to see images
contact phil.
Info
image of what's
been done (jpeg)
field with sources
removed (jpeg)
Links to Sections and Plots:
Intro
The steps in processing the data
Map positions raw data
Plot:
sampled
map
positions for each field (.ps) (.pdf).
Removing Tsys.
The individual maps by field
The
average maps for each field (.gif)
Mosaicing the 11 + 4 maps
together
The
final mosaiced maps (.gif):
Intro: (top)
A2415 mapped 9 overlapping fields at 430 MHz using the
gregorian. Data was sampled at 1 hz. Each field
was
covered in the ra and then the dec direction for basket weaving. The
12.5
MHz bands with 2048 channels were used to computed the total power.
After processing the data the polA data showed instabilities, so the
maps,images were only made with the polB data. The 4 maps made for
a2125 were also included in the mosaicing.
Data was taken aug-dec09 and dec10. The a2125
data was then included in the final combined map.
| mapname |
map center
ra, dec
|
date taken
|
| Field1 |
00:51:00, 35:15:0
|
aug09
|
| Field2 |
01:10:30, 35:15:00
|
aug09
|
| Field3 |
01:09:30, 31:57:00
|
oct09
|
| Field4 |
01:08:30, 38:15:00
|
aug09,oct09
|
Field5
|
01:07:30, 24:27:00
|
aug09
|
Field6
|
00:50:30, 24:27:00
|
aug09
|
Field7
|
00:33:30,24:27:00
|
aug09
|
Field9
|
00:16:20, 26:05:00
|
aug09
|
Field11A
|
01:27:20, 31:21:00
|
dec10
|
Field12
|
01:26:30, 28:15:00
|
aug,oct,dec09
|
Field14
|
01:25:00, 25:09:00
|
dec10
|
a2125 fields (_05 added to
fieldname)
|
|
|
Field1_05
|
00:50:38 , 23:31:00 |
|
| Field2_05 |
00:34:42 , 28:31:00 |
|
| Field3_05 |
00:50:55 , 32:01:00 |
|
| Field4_05 |
00:34:25 , 32:01:00 |
|
processing: usr/a2415/aug09/
The steps in
processing
the
data (top)
The steps in processing the data were:
- see a2125 steps in making
the
maps.
- Mosaic the 11 + 4 fields together.
- Mosaicking was done on a pair wise basis looking at the ra
and
dec overlaps. This is not the optimum method but ...
Map
positions (top)
The plots shows the sampled
map positions for each field (.ps) (.pdf).
- Pages 1-3 shows the az,za positions for each field
- Page 4 has the ra/dec sampled positions for each field.
processing: chkalldata_pltpos.pro
Removing Tsys (top)
We need to remove Tsys (excluding the sky
contribution since that is what we want to measure). This is
explained
in a2125.
It includes:
- Create a model of the za dependence of Tsys using the x102
data
(tsysX102M). Normalize this so tsysX102M(za=10) is 1.
- For each map (ra,dec strips processed together):
- fit for the scale factor TsysData(za)=tsysX102M(za)*scale
- TsysRemoved= TsysData(za) - tsysX102M(za)*scale .. this
is
done separately for pola, polb.
- If the actual Tsys changes over time ,this should help correct
for that.
- If the cal Values change (without remeasuring them), then the
0
of tsysRemoved should be ok, but the scaleFactor of tsysRemoved
will
still be off (since we didn't scale it by the change in the cal
values).
Plots of Tsys for fields 1 thru 14.
- Plot (TsysA/TsysB -1) before
fitting or
corrections
- The
data has been converted from correlator counts to kelvins
using the
cals (after cal fitting).
- Top:
TsysA/TsysB-1 vs za
- 2nd:
TsysA/TsysB -1 vs az
- bottom:TsysA/TsysB
-1 by field
- dashed
green lines separate fields.
- Cal scale factors by field
(.ps)
- These
values are computed from the cals on every strip. they
convert from
correlator counts to Kelvins.
- black
(polA) ,red(polB) after cal fitting
- green(polA),
blue(polB) before cal fitting
- Cal
fitting takes adjacent cals (with no attenuation changes)
and does a
linear fit to the measured scaling factor ( throwing out
outliers). The
fit is then used to convert correlator counts to kelvins
rather than
the individual measurements.
- If
there are no outliers than the blue,green overlay the black,
red traces.
- Global fitting of all the
data:
- Fitting Tsys by Field.
- When the images are made,
Tsys is removed
from the ra and dec scans simulataneously
- We left them separate here to see if the
ra, or dec scans had any outliers.
- Tsys
residuals by field
(rascans and decscans together).
- Same
as above plots but the scaling fit is done with ra and dec
strips
together. This is how the images are made.
- Black
is polA, red is polB.
- The
scale factor and errors are included in the title for each
plot.
- Fields11A,12,3 Some fields that
didn't
mesh well (.ps)
- Each
page shows the Tsys-fit (by map) plotted vs rahr and dec to
see if
there is any obvious bad data.
- Black
is pola, red is polB
- Page
1: Field11A
- Bottom:
decstrips vs ra. raHr 1.51 -> end polA has slope to it.
- Since i didn't use polA, shouldn't matter.
- Page
2: Field12
- Frame
2 ra strips vs dec.
- decs 26->26.6 polB is low. This will
be part of the overlap with Field14 below it.
- Frame
4: decstrips vs ra
- ra 1.27 -> 1.37 hrs, PolB is high and
polA is low. This is part of the overlap with Field 4
(to the right).
- Page 3: Field3
- Frame
4 dec strips vs ra.
- looks like a jump at middle of map: ra
1.15 hours. Both polA and B go from low to high
Some of these things will be
fixed
by the basket weaving.
The individual
maps.
(top)
After removing Tsys and scaling to janskies, each
field
was gridded. The process was:
- grid the ra driven and dec driven maps separately to the same
grid.
- Grid spacing was 3 arcminutes.
- The gridding function used a gaussian with a fwhm of 5.5 (it
was
repeated
with a gaussian of 11 aminutes).
- The gridding function extended out to about 30 arcminutes.
- A sin projection was used to project onto the 2-d
grid.
- basketweave the two maps. Create an average map and a
difference
map after basketweaving.
- The basket weaving will try an remove offsets in strips.
The
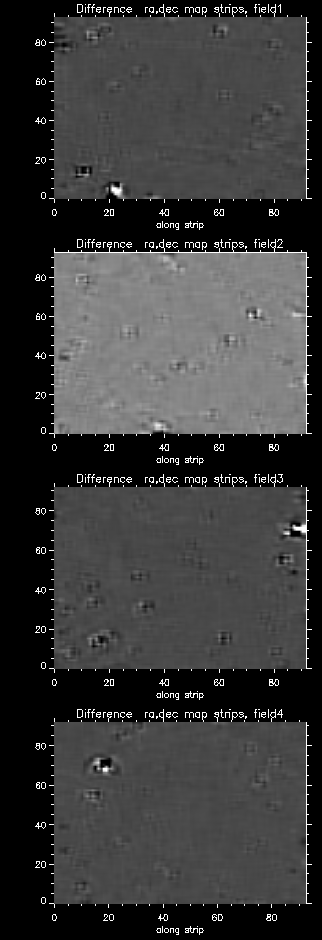
average maps for each field (.gif) show the results.
processing: aug09/lookimgidl.pro
Mosaicing the
fields.
(top)
The 11 fields from a2415 plus the 4 fields of
a2125
were to be combined into a single
image.
The processing to do this was:
- take each pair of overlapping maps.
- Interpolate the first map of each pair to the grid
position
of
the
second (within the overlap region).
- compute mapRaDif=(map2 - interpolated Map1) in the
overlap
region
- Fit a linear polynomial to the differences as a function of
the
ra
position
- Correct the two maps by subtracting half the difference from
map2
and
adding
half the difference to map 1
- Repeat steps 1 5 with the corrected fields, using the dec
overlap
of the pairwise maps.
- 21feb11: changed so that 1-6 only corrects 20% of the
difference.
It then interates 1-6 5 times. This gets rid of jumps caused by
the
correction.
The plots below show the pairwise difference of the overlap regions
of
the maps.
- the units are Janskies (multiply by 10 to get kelvins).
- Pages 1-3. Overlap in ra direction with
map1-map2Interpolated plotted vs ra.
- The red line is the fit vs ra.
- Page 2, frame 2 Field12 - Field11A vs ra has a large
offset and slope
- Pages 3-7. Overlap in dec direction with map1 -
map2Interpolated
plotted vs dec.
- Each set is the start of iteration i (i=1 to 5). the last one
is
when everything is done. The set shows how the correction
progresses with a correction factor of 20% per iteration.
Processing: combinemaps_scl.pro
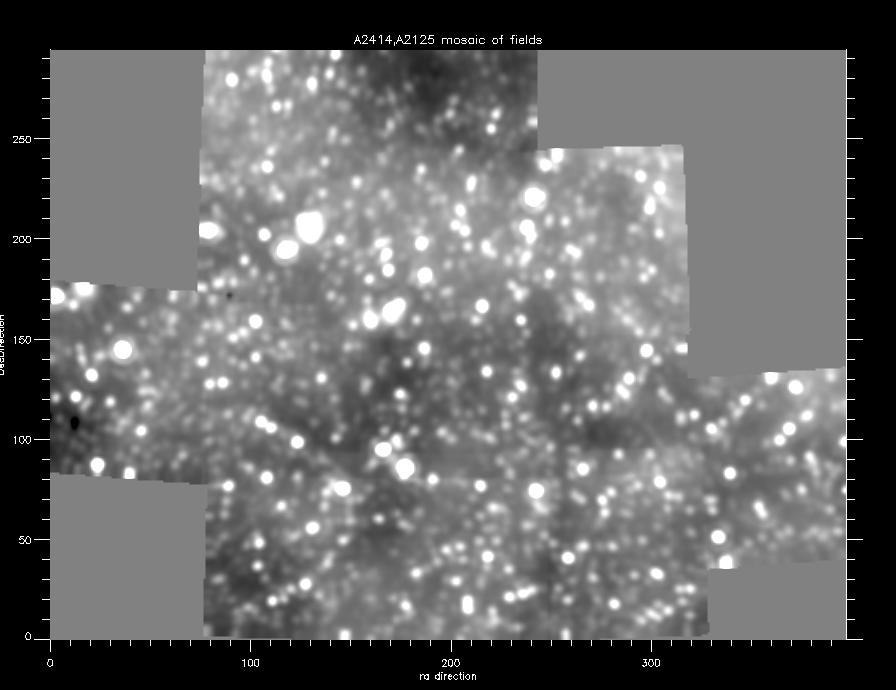
The
final mosaiced maps (.gif):
The final mosaiced maps with positions
(.gif)
- The x,y positions are just grid points along the ra,dec
direction.
- This used a 5.5 arcmin gridding function. The final resolution
is
about
14 arcminutes.
Processing: combinemaps.pro
Notes on the fields. (top)
- Trouble with PolA 2009 data.
- There were large jumps in polA. see 10aug09
- Ended up just using polB when making final map (but it is
circular).
- Dec10: TsysField11A, TsysField14
- Looking at the globally fit data, TsysA - TsysFit has a
median
of -9Kelvins for these 2 fields
taken in dec10.
- TsysB11a -TsysFit is +4K
- Must be that calA has changed since the calibration fit
values
were made.
- Field11A,Field12 dec overlap.
- there is an offset in the dec overlap of these fields of .1
Jy
and a slope of about .2 Jy across the map. This is removed
during the mosaicing.
- Field 12.
- Dec strips at low ra , polA is low and polB is high.
home_~phil