A2125 430 Mhz mapping nov05
mar07
Links to Sections and Plots:
Intro
The steps in processing the data
Map positions raw data
Plot:
sampled map positions for each field (.ps) (.pdf).
Tsys for the 4 fields.
Plot:
Measured Tsys for the 4 fields vs za and epoch (.ps) (.pdf):
Plot:
Ratio TsysPolA/TsysPolB (.ps) (.pdf)
Fitting to Tsys
Making the model
Plot:
The x102 calibration data and tsys model fit (.ps) (.pdf):
Fitting all the data at
once
Plot:
Tsys vs za with fit overplotted (.ps) (.pdf).
Plot:
Fit residuals vs za by field (.ps) (.pdf).
Plot:
Tsys fit residuals vs za. separate out by ra, dec scans and by
field(.ps)
(.pdf):
Plot:Tsys
fit residuals vs za. separate by epoch (.ps) (.pdf):
Fitting by field and
epoch.
Plot:Tsys
fit residuals vs za with fit overplotted (.ps) (.pdf):
Plot:
Fit tsys by epoch. Tsys Fit residuals vs za (.ps) (.pdf):
The individual maps by field
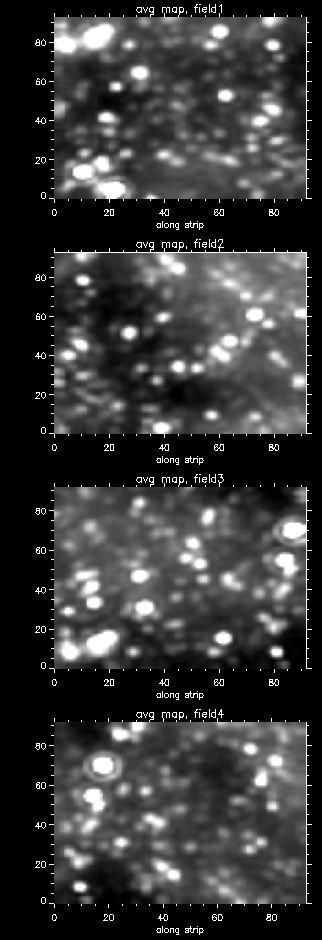
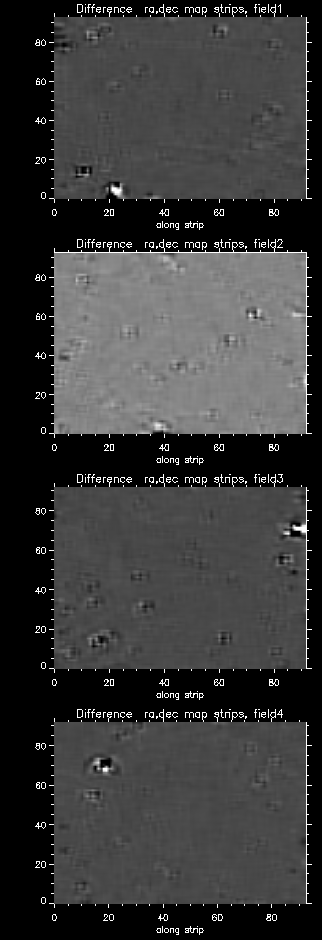
Plot:The
average maps for each field (.gif)
Plot:The
difference maps for each field (.gif)
Mosaicing the 4 maps together
Plot:The
ra,dec differences of the overlap regions before the corrections (.ps)
(.pdf)
Plot:The
ra,dec differences of the overlap regions after the corrections (.ps)
(.pdf):
Plot:The
final mosaiced maps (.pdf) (.ps):
Intro: (top)
A2125 mapped 4 overlapping fields of 5 deg by 4.7
degrees
at 430 Mhz using the gregorian. Data was sampled at 1 hz. Each field
was
covered in the ra and then the dec direction for basket weaving. The
12.5
Mhz bands with 1024 channels were used to computed the total power.
Data was taken in nov/dec 2005 and a few strips
in
oct 2006.
| mapname |
map center |
| Field1 |
00:50:38 , 23:31:00 |
| Field2 |
00:34:42 , 28:31:00 |
| Field3 |
00:50:55 , 32:01:00 |
| Field4 |
00:34:25 , 32:01:00 |
| Field1234(combined) |
00:42:25, 30:13:46
504' by 486' |
processing: usr/a2125/dec05/...
The steps in processing
the
data (top)
The steps in processing the data were:
-
Input the data, remove rfi, compute total power (inputprocdat,
inputmap,mkmask,testrfi).
-
The routine inpprocdat was called twice:
-
The first call with firsttime=1 determines which channels are good in a
strip.
-
inputmap() inputs the entire map and calls mkmask().
-
mkmask() creates a channel mask for each spectra
of each strip.
The masks are created by fitting an 8th order harmonic to each bandpass
and flagging any fit residuals above 3 sigma. A value less than 3
sigma is assigned 1 while residuals greater than 3 sigma get 0. An
average
mask for each strip is created by averaging the masks for each strip.
-
The average mask for each strip is stored in an idl save file.
-
The second call uses the average masks for each strip to compute
the total power.
-
The mask processing is done separately for each cal on/off for each
strip.
-
For a channel to be included in the total power it must be ok for 95%
of
the spectra in a strip and it must also be ok in the cal on/off (since
the cal will affect the entire strip).
-
The data is over sampled in the driven direction (ra for maps, dec for
decmaps). The routine testrfi() subtracts a smoothed version of
the total power along a strip and looks for points that stick up. These
are usually rfi that lasts for a short time (less than the time for a
source
to transit the beam). A weight array (assoc()) is constructed with
these
impulsive points given a zero weight.
-
The weight arrays are stored in an idl save file along with the total
power.
-
Make maps for each field. (doallmaps(), mktpimg(), getmaps(),
tsysremove(),
cmgaincor(), aogridzilla(), basketweave().)
-
getmaps() inputs the total power data, cals, and weight
arrays from
the idl save files. If any duplicate strips are present, an algorithm
is
used to select the best 1. The cals that were taken contiguously in
time
are fit to a linear polynomial (to find problems where the cal was
taken
while a source was passing through the beam).
-
tsysremove() removes the system temperature from the data
(see more
about this below).
-
cmgaincor() converts the data to janskies using the gain
curves.
For 430 they are a function of just za.
-
aogridzilla() grids the ra driven maps and the dec driven
maps (which
cover the same area).
-
basketweave() will basketweave the two maps correcting for
dc offsets
in a strip.
-
The average the ra,dec maps after basketweaving are written out as fits
files. The difference between the two maps (after basketweaving) are
also
output for diagnostic purposes.
-
Mosaic the 4 fields together.
-
Compute offsets between maps for mosaicing (combinemaps_scl()).
-
The ra overlap (fields 1/3, fields 2.4) and the dec overlap (fields 1,2
and fields 3,4) are used to compute offsets vs ra and dec for each map.
-
The overlap region of the first map is interpolated to the positions of
the second map and then the differences map1Iinterp - map2 are computed.
-
The difference is then split between the two maps.
-
This is done first for the ra overlaps and then the dec overlap fields.
-
The 4 corrected maps are then combined using aogridzilla().
Map positions (top)
The plots shows the sampled
map positions for each field (.ps) (.pdf).
-
Figure 1 shows the az,za tracks for each field. Black are the ra driven
scans and red are the dec driven scans.
-
Figure 2: This has the ra/dec positions sampled for each field.
processing: chkalldata_pltpos.pro
Tsys for the 4
fields.
(top)
-
Page 1 Tsys vs za by epoch. Each plot is a separate field. Black and
red
are polA,polB before jan06. Green, blue are polA, polB after jan06.
-
In field3 PolB (blue) looks higher than polA(green). This may
also
be true in field2 and field 4 (although it is not as obvious).
-
Page 2 has the median value for each za by field and epoch. Black is
data
before jan06, red is data after Jan06. The different fields are
plotted
with different fields.
-
PolB red looks higher after jan06 than before.
processing: plottsys_all.pro
Ratio
TsysPolA/TsysPolB (.ps) (.pdf)
. Black points are before jan06 while red points are after jan06.
-
Top TsysPolRatio vs za.
-
Middle TsysPolRatio vs az. There is a drift to higher values at lower
azimuth
values.
-
Bottom TsysPolRatio by map. The data is laid out by map. Each map
starting
at first strip taken. The dashed green lines are where the maps change.
-
The red points (after jan06) seem to fit in with the variation within
the
maps. The offsets with polB larger than polA after jan06 may be related
to the sky and not the diodes.
processing: chkalldata_plttsys.pro
Fitting to tsys (top)
Tsys (minus the sky contribution) needs to be
removed
from the data. This is complicated by sky contribution from the many
sources.
Another difficulty is the stability of the cal values used for each
strip.
The fit used a model that was generated from the x102 calibration data.
The model was normalized to equal 1 at za=10. The
Tsys fit consisted of:
-
Compute a single scaling value by dividing the Tsys data by the model
and
computing the median value. The fit value is then the tsysModel*Scale
-
Compute a robust mean and sigma of (data - fit).
-
Throw out all points whose residuals are greater than 2.5*sigma. This
tries
to get rid of points that are positive because of sources.
-
Iterate the process. After about 3 passes, nothing changed.
The fitting processes was tried with all of the data
together, and then 1 field at a time. The final maps used the tsys fit
by field.
Using the calibration data
to make a model for Tsys. (top)
The Tsys fit used a model (TsysM) that was a
function
of zenith angle. The model was made from the x102 calibration runs for
the 430 receiver. Calibration data was taken from jan05 thru feb07. The
steps for the model were:
-
Use the 1.25 Mhz band at 431.
-
Find the separate source tracks across the dish that had at least 10
points.
-
For each set of tracks add an offset so that Tsys(za=17) = 54. This
tried
to subtract off any background sky temperature.
-
If the cals had jumped, this would not do the correct thing (you'd need
a scaling).
-
If the source track did not get to za=17, it was ignored.
-
Fit a linear polynomial plus a 3nd order polynomial above za=10
deg.
-
Normalize the fit so TsysM(za=10)= 1.
The plot shows the
data and tsys model fit (.ps) (.pdf):
-
Page 1 input calibration data:
-
Top az, za tracks for the sources.
-
Center Tsys vs za. Each track is a different color
-
Bottom Tsys vs az.
-
Page 2 Correct Tsys data and fit.
-
Top: Corrected Tsys data vs za and the fit.
-
Bottom: Correct Tsys data vs az.
A better method (but nonlinear) would have been to
fit
a constant + a scaling factor for each source track. This would try and
fit the background sky temperature variation plus any changes in the
cals.
processing: a2125/tsysfit/doit.pro
Fitting Tsys to all the data
at once. (top)
The Tsys Fit was first done to all the fields at
once.
The plots show the results:
processing: dec05/chkalldata_plttsys.pro (plots
_1,_2,_3,_4).
Fitting Tsys by field,
epoch
(top)
Tsys was refit by field using the same fitting
model.
The results are:
Summary of Different Fits
| Data Set |
SclPolA |
SclPolB |
| Fit all Data At once |
53.48+/-1.15 |
53.64+/-1.20 |
|
|
|
| Fit epoch 1 alone |
53.42+/=1.11 |
53.56+/-1.18 |
| Fit epoch 2 alone |
54.19+/-1.32 |
54.25+/-1.24 |
|
|
|
| Field1 alone |
53.11+/-1.05 |
52.70+/- .88 |
| Field 2 alone |
53.04+/-1.04 |
53.26+/- 1.05 |
| Field 3 alone |
53.99+/-1.08 |
53.92+/-.92 |
| Field 4 alone |
53.78+/-1.07 |
54.32+/-1.07 |
The map data processing fits tsys by field. The
basket
weaving will attempt to correct for any offsets. Cal changes will be
partially
corrected for by this.
processing: dec05/chkalldata_plttsy.pro (plot_7),
chkdalldata_fittsysbyepoch.pro
The individual
maps.
(top)
After removing Tsys and scaling to janskies, each
field
was gridded. The process was:
-
grid the ra driven and dec driven maps separately to the same grid.
-
Grid spacing was 3 arcminutes.
-
The gridding function used a gaussian with a fwhm of 5.5 (it was
repeated
with a gaussian of 11 aminutes).
-
The gridding function extended out to about 30 arcminutes.
-
A sin projection was used to project onto the 2-d grid.
-
basketweave the two maps. Create an average map and a difference
map after basketweaving.
-
The basket weaving will try an remove offsets in strips.
The
average maps for each field (.gif) show the results. The images
have
been clipped to < 1 Jy. Ra increases to the right in the x axis.
The
difference maps for each field (.gif) show where the ra,dec strips
differed (after basket weaving). The difference will be largest by
sources.
processing: dec05/doallmaps.pro
Mosaicing the
fields.
(top)
The 4 individual were to be combined into a single
image.
The processing to do this was:
-
Compute the ra intersections between field1,2 and fields
3,4.
-
Interpolate the first map of each pair to the grid position of
the
second (within the overlap region).
-
compute mapRaDif=(map2 - interpolated Map1) in the overlap region
-
Fit a linear polynomial to the differences as a function of the ra
position
-
Correct the two maps by subtracting half the difference from map2 and
adding
half the difference to map 1
-
Repeat steps 1 5 with the corrected fields, using the dec overlap of
maps
1,3 and maps 2,4.
The
ra,dec differences of the overlap regions before the corrections (.ps)
(.pdf)
: The differences were for identical positions on the two maps (after
interpolation).
-
Page 1 Ra axis (Overlap in dec).
-
Fields1,2 and Fields 3,4 have short overlaps in ra (since
they
are at the same dec).
-
Fields 1,3 (leftmost two fields) show a slight rise in power as ra
decreases
(left to right).
-
Fields 2,4 (rightmost two fields) show a larger increase in power as ra
decreases.
-
Page 2 Dec axis (overlap in ra)
-
Field 1,2 have a constant offset versus dec.
-
Field 3,4 have a slight increase for the first have of the maps
(moving
up in dec). They then level off.
-
Field 1,3 and 2,4 have short overlaps in dec.
-
Page 3 shows the diagonal map overlaps: field1-4, field 3-2
plotted
versus ra and then versus dec.
-
Page 4 plots the data before subtractions for the long axis.
-
Top field 2,4 overlap. The are the same at the beginning then field 2
rises
faster than field 4.
-
Bottom field 3,4 overlap. They look to have a pretty constant offset.
processing: cmpmapoffsets.pro
The
ra,dec differences of the overlap regions after the corrections (.ps)
(.pdf):
-
These plots show the difference of the overlap maps after
correction.
-
The large jumps are at sources where the interpolation of map1 to
positions
of map2 did not do a good job.
processing:combinemaps_scl.pro
-
The maps have been clipped to 1 Jy.
-
The ra scale is for the center of the map
-
This used a 5.5 arcmin gridding function. The final resolution is about
14 arcminutes.
Processing: combinemaps.pro
To be worked on. (top)
-
The tsys removal is not perfect. It might have been better to try
fitting
all the fields at once to Tsys rather than 1 field at a time. The
linear
fitting of the cals, the basketweaving, and the scaling of the
individual
maps from the overlap region try to correct for this.
-
There are pointing errors at the beginning of some strips because the
telescope
is trying to catch up. The data points should be interpolated here.
home_~phil