cb az swings, 4-5GHz rfi 07feb19
13feb19
Intro
Data from the
hilltop rfi monitor
azswing data processing
dynamic spectra
peak hold spectra
for each az swing.
birdie power vs azimuth
summary
Previous azmiuth swings:
16aug16:
cband azswing covering 4715-5486 MHz
08aug16:
cband azswing covering 4715-5486 MHz
28jun16:
cband azswing covering 4715-5486 MHz
13jan16:
cband az swing. 5GHz rfi.
plots/images
rfi
hilltop monitor spectra during the 6 azimuth swings (.ps) (.pdf)
Plots
of total rfi hilltop monitor power vs date for the different rfi
bands (.pdf) (3.9MBytes)
dynamic spectra entire
4-5 ghz each az swing
dynamic spectra for each 160Mhz
mock band for each az swing
the peak hold spectra for each swing (.ps) (.pdf)
plots
of average rfi power vs azimuth for different rfi bands
(.ps) (.pdf):
Info
FCC
frequency allocation table for 3500-5000 MHz (.pdf)
Commercial
point to point microwave licenses
Locations of
transmitters in pr (lat,long, bearing from ao.
Intro: (top)
Strong interference has been seen in
the 4-5 Ghz band. Data taken with a spectrum analyzer from the
12meter hill showed some of this rfi (more
info).
Azimuth swings (on the 305m telescope) were done on 07feb19. The
setup was:
- cband receiver was used. freq range recorded was 4-5 GHz.
- Previous azimuth swings tended to cover 4700_5500 MHz.
- The mock spectrometer was used to record the data.
- 7 160MHz bands were used (with a 10mhz overlap on each
edge).
- 8192 channels / band (20Khz freq resolution) and 1 second
integrations.
- When generating images, the images covering the entire band
have 600 Khz resolution , while the individual band images
have 120 Khz resolution
- 6 360 azimuth swings were done: 3 Clockwise (CW) and 3 Counter
clock wise (CCW)
- The rfi looked like it might be time as well as azimuth
dependent, so multiple swings were done.
- The gregorian dome was at 18 deg.
- The azimuth moved from 270 to 630 degrees and back at .35
deg/second.
- The weather was clear during the swings.
- The data was taken 16:15 to 19:45 AST.
Data from the
rfi hilltop monitor. (top)
The rfi hilltop monitor uses filters,
amplifiers, switches, and a spectrum analyzer to monitor the rfi
environment from DC to 10Ghz.
The frequency range is broken up into 20 separate frequency bands.
- A 1 minutes peak hold on the spectrum analyzer is done
at each band.
- The system returns to the same band every 20 minutes.
- The 4-5 GHz band has 401 points over the 1 GHz bandwidth.
The first plot shows the 1
minute peak hold spectra during the 6 azimuth swings (.ps) (.pdf)
- there are 9 spectra over plotted.
- The vertical scale is dbm and measured by the spectrum
analyzer (after the amps and filters).
- The dashed green and red lines mark parts of the spectrum
where the average power was computed over time (in the following
plots).
Plots of total power vs date
for the various rfi (.pdf)
- The average power for each of the 4 bands flagged above, was
computed and then plotted vs time.
- the bands were:
- 4220-4340
- 4450-4700
- 4630-4700
- 4750-4800
- The red color is the average power over the rfi band
- the black color is the median bandpass over the 4-5 ghz band
- Page 1: Average power vs time 2012 - 2019
- each frame is a separate frequency band.
- The steps in the total power around aug2015 is probably the
amp/atten changes to the monitoring system.
- Some of the narrow spikes may be 430 Mhz transmitter
harmonics getting into the system (i tried to remove the data
when the sband or 430 Mhz transmitters were on).
- Top: 4220-4340. this is part of the aeronautical radio
navigation assignment
- The power levels changed toward the end of 2013.
- it was on,off during the day. after 2013 It changed to
always on.
- You can see the drop around sep17. this was hurricane
maria leveling the transmitters (or planes?)
- The bottom 3 frames seemed to have gotten stronger toward
the end of 2018.
- Page 2: blowup sep18 - feb19
- the bottom 3 rfi bands are plotted for sep18-feb19
- The 4450-4700 and the 4630-4700 rfi bands got a lot stronger
around oct18.
- there changes tracked one another. They may be coming from
the same source.
The azswing data processing for each
board (top)
For each azimuth swing the following processing
was done:
- input the 1 second spectra
- average pola and b.
- interpolate az positions to the center of the data records.
- For the dynamic spectra two sets of data were processed:
- combine all frequency bands into 1 spectra.
- for each freq band a median spectra was computed
over all data for that band and then used as the bandpass
correction.
- interpolate each freq band spectra onto a fixed spacing
grid that covers all the bands
- these images had lower frequency resolution (because of
the limited number of pixels on the screen).
- Individual dynamic spectra were made for each frequency band
from the first az swing.
- this had higher frequency resolution than the combined
images.
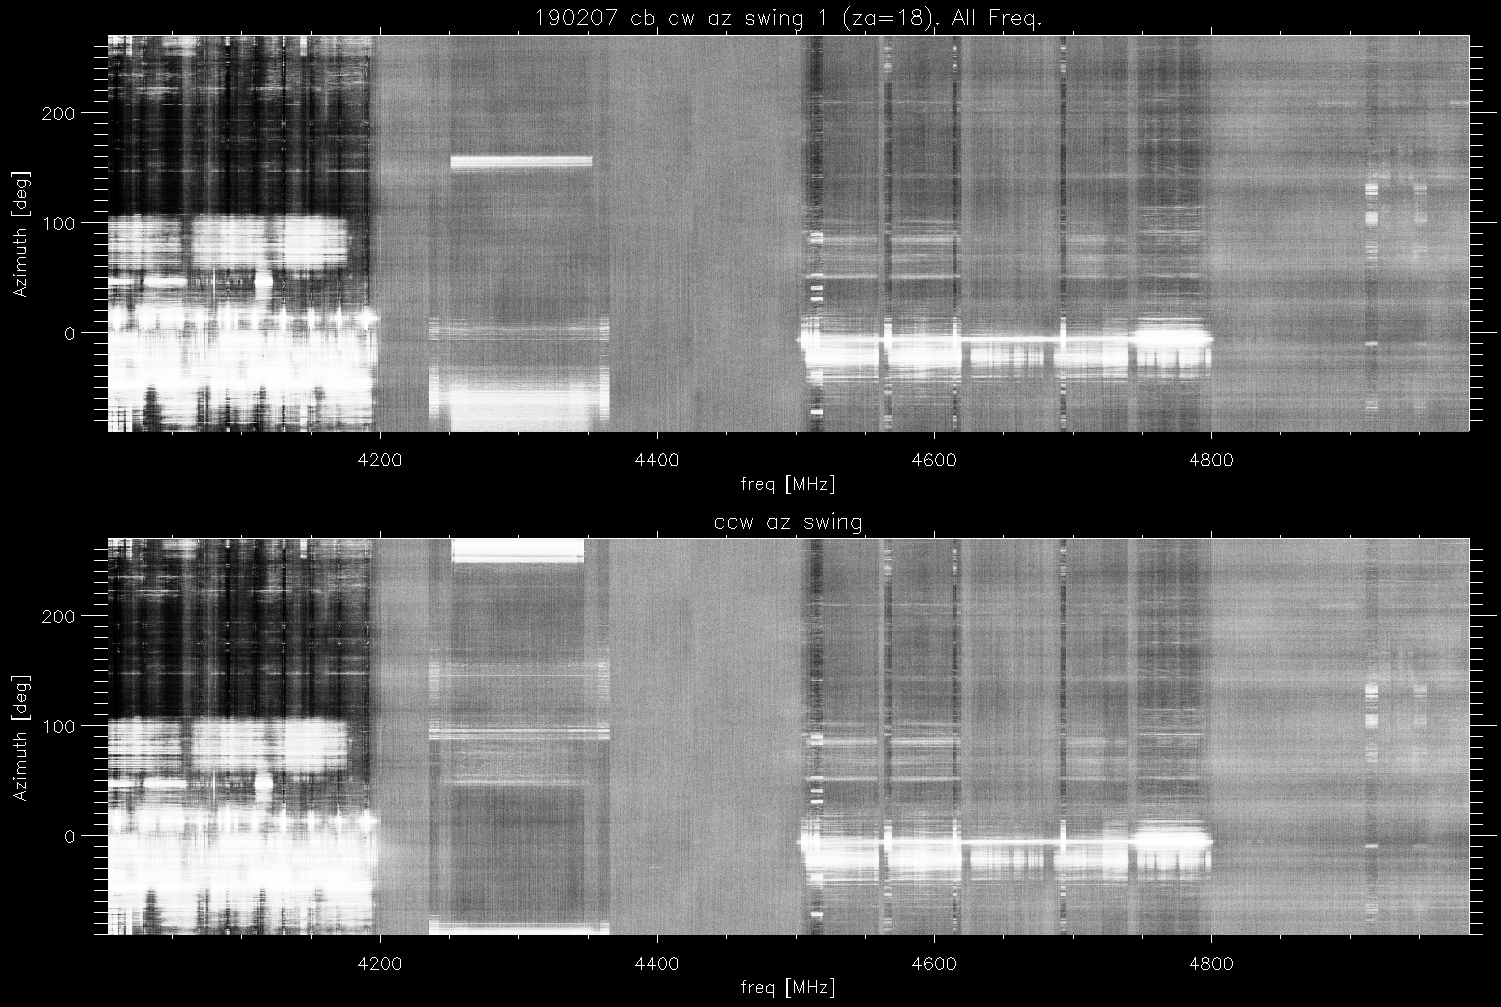
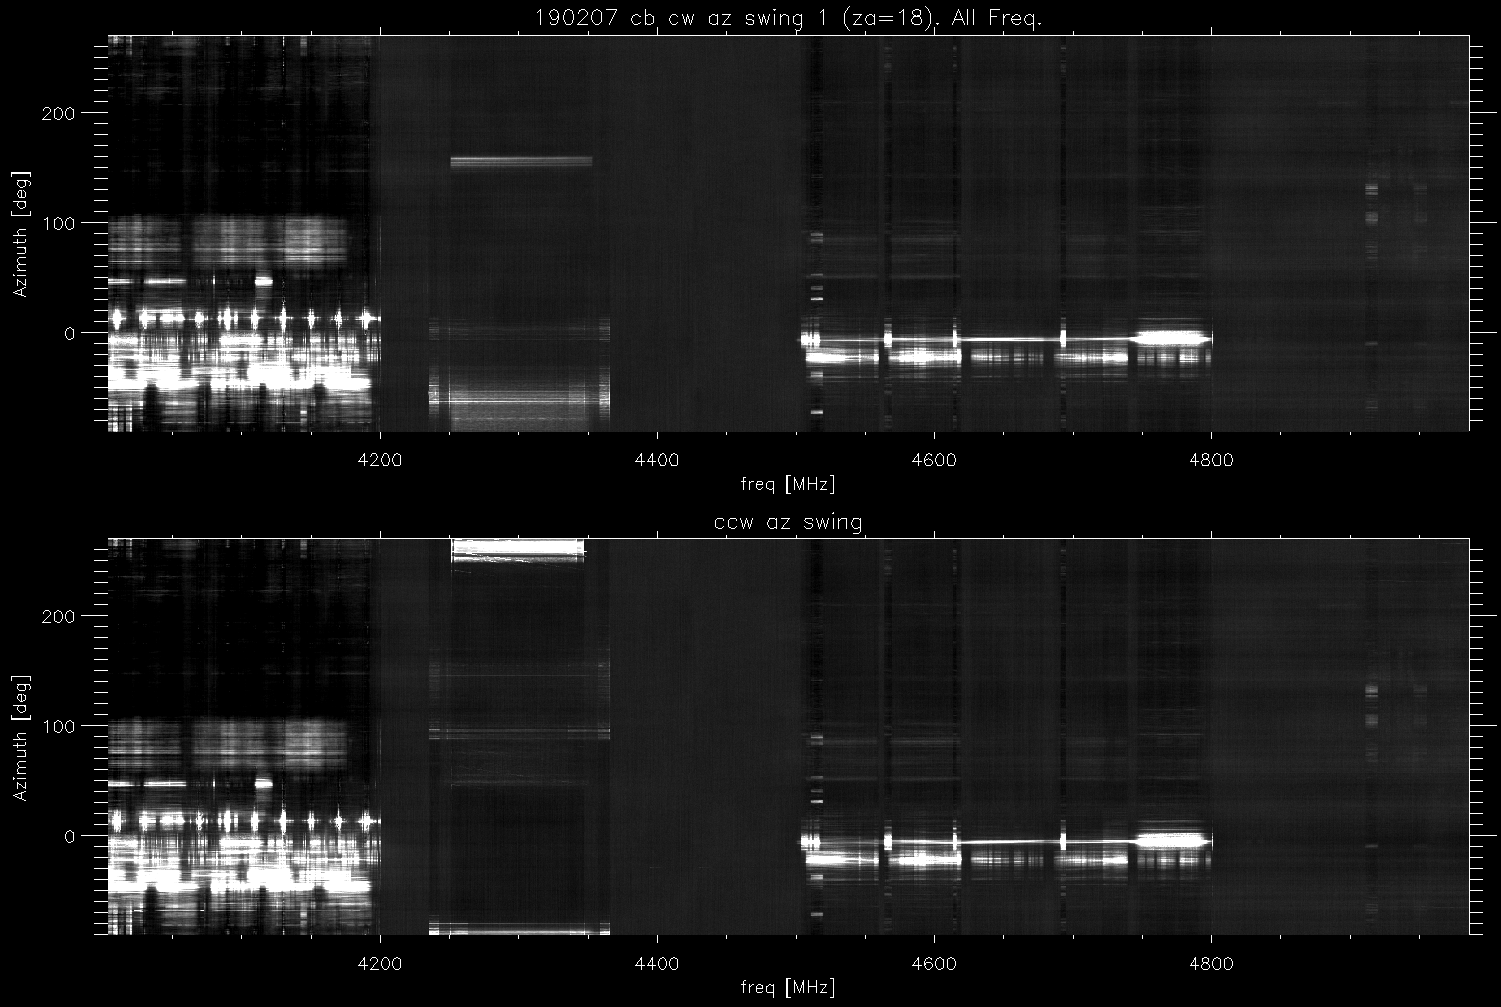
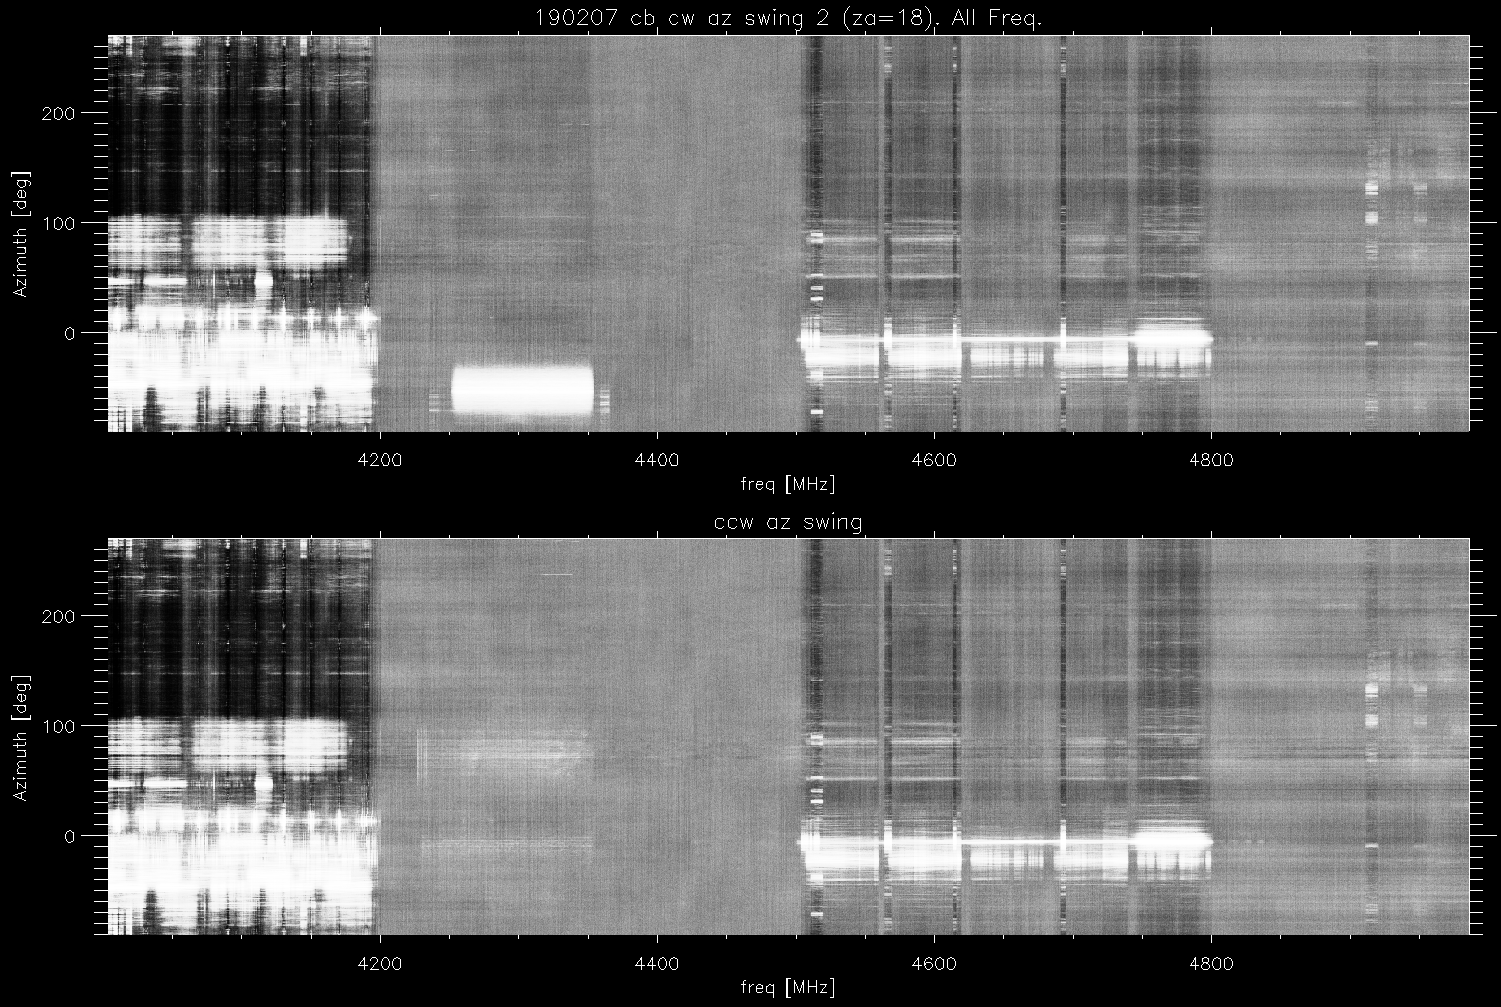
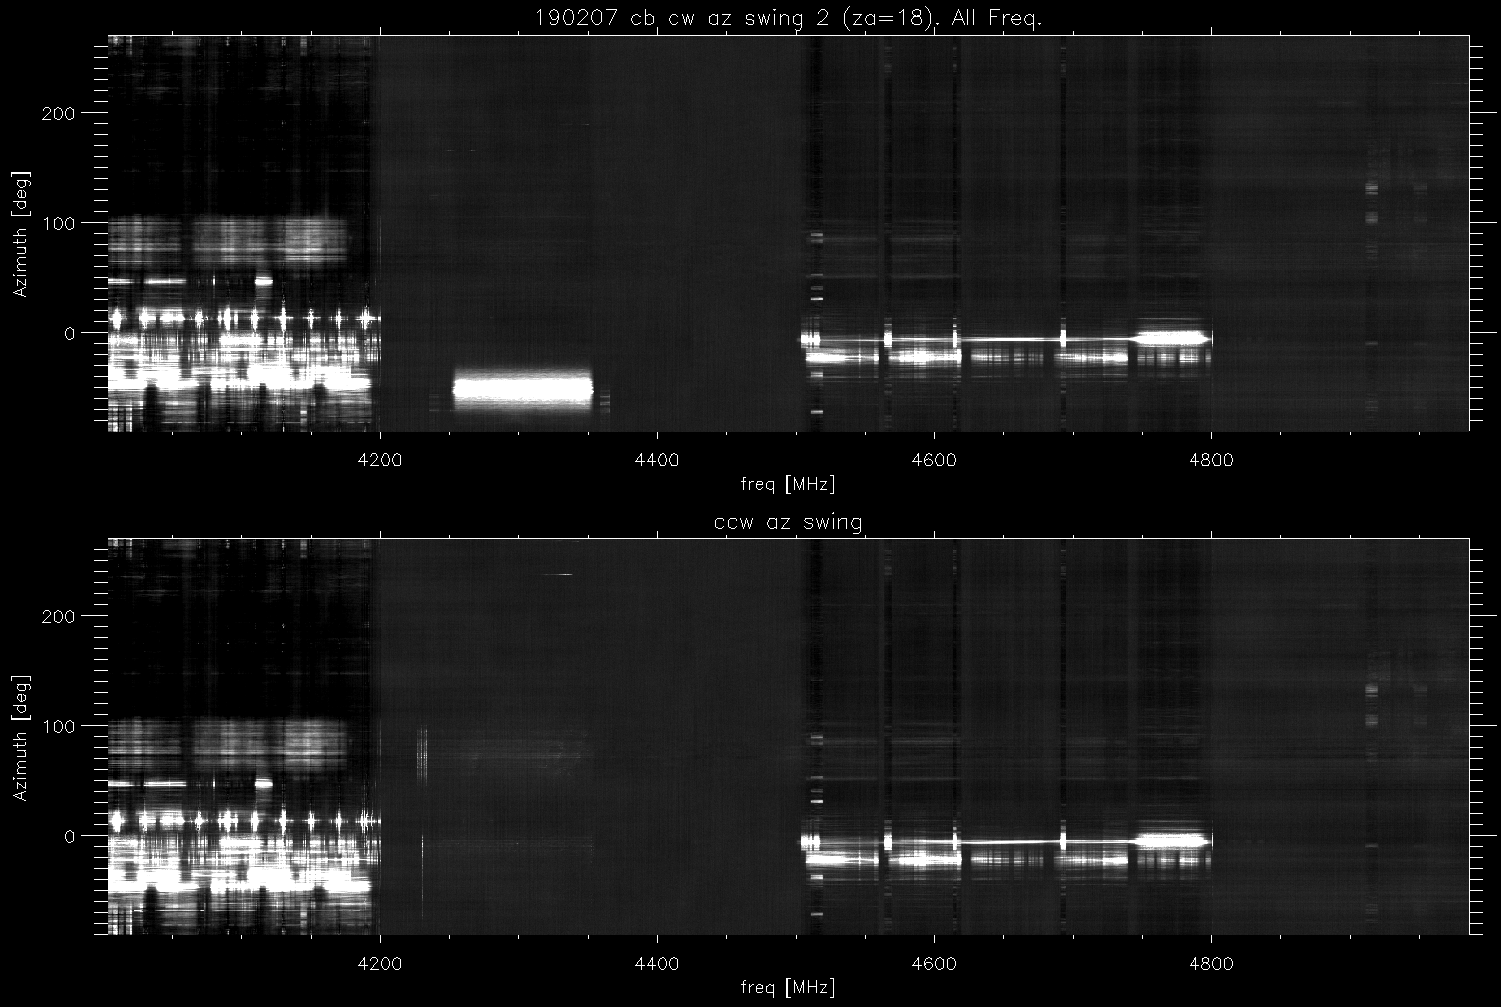
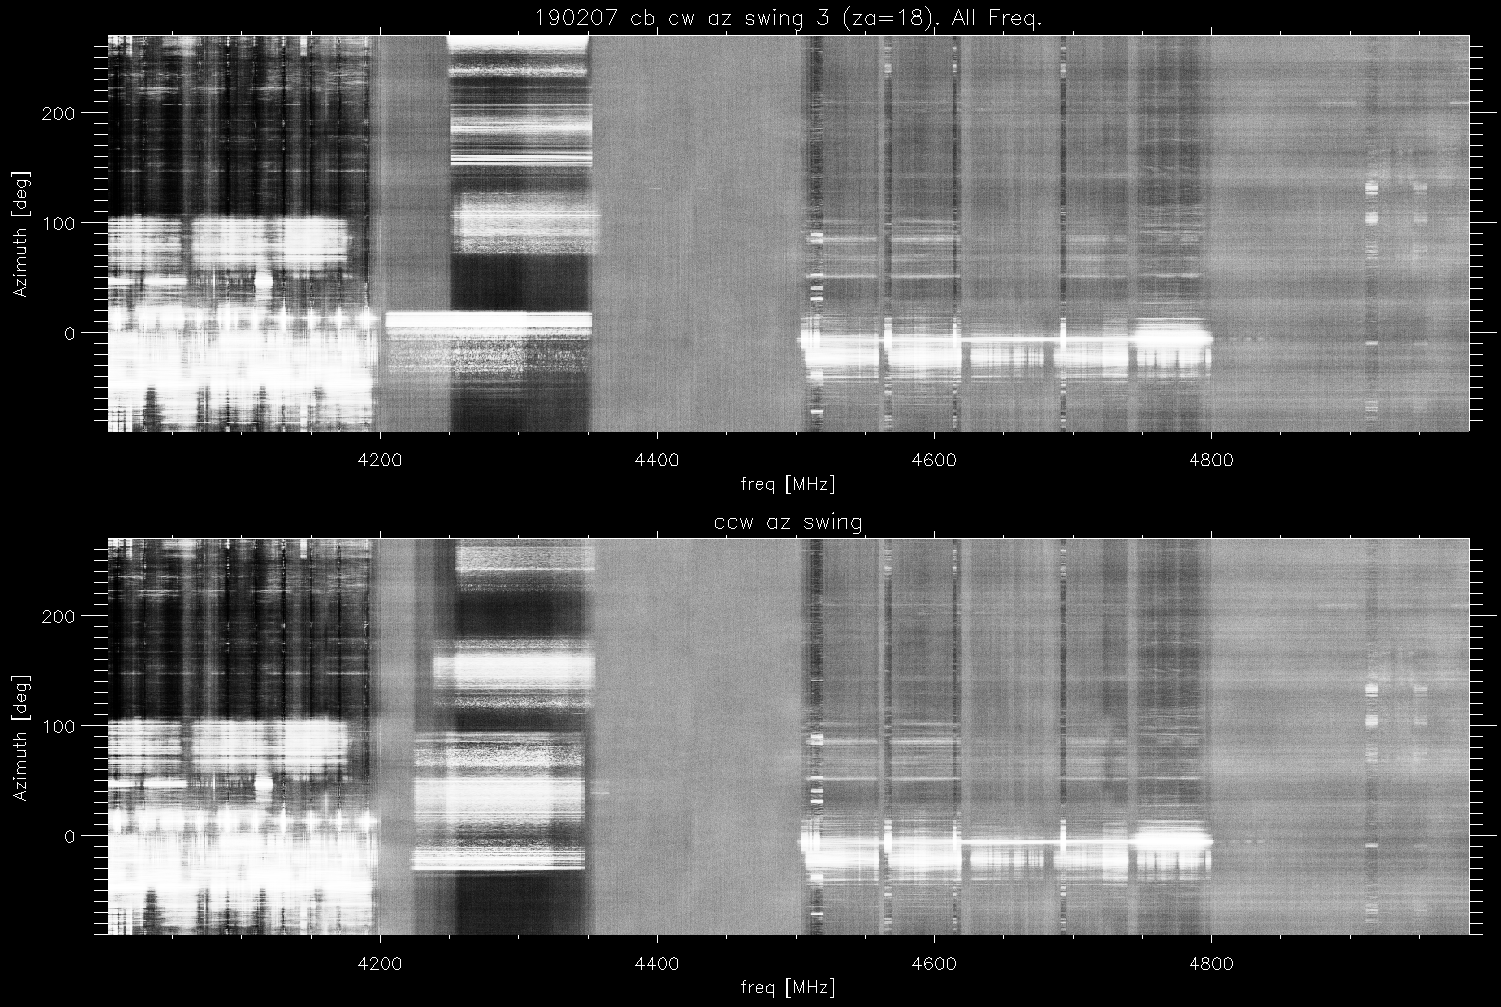
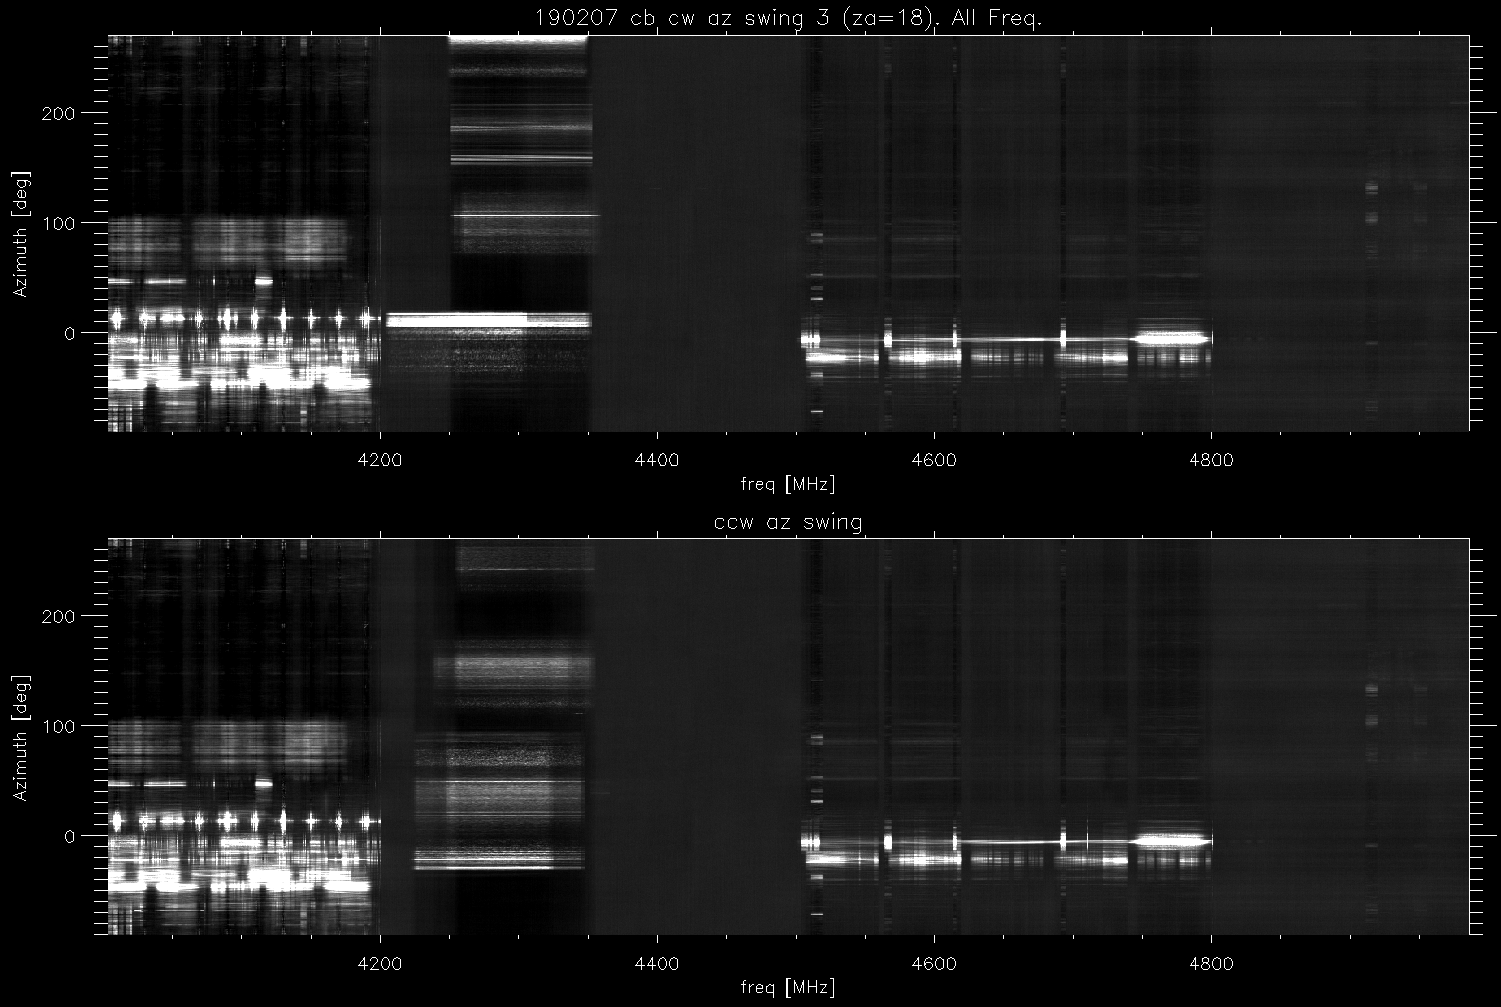
The az swing dynamic spectra:
(top)
All frequency
bands in 1 image:
There are two images in each file.
- the top frame is the clockwise az swing.
- The bottom frames is the following CCW az swing.
- The first column has a high sensitivity image (where some
things are saturated). The 2nd column has a lower sensitivity
version of the image where the stronger signals are not as
saturated.
azswing (CW then CCW)
|
high sensitivity
|
Low sensitivity
|
azswing 1
|
(.png) |
(.png) |
azswing 2
|
(.png) |
(.png) |
azswing 3
|
(.png) |
(.png) |
1 freq Band per image
- Each row is a separate frequency band (as taken by the
mock spectrometer).
- each column is a different azimuth swing.
- In each image the top frame is the clockwise spin while the
bottom frame is the ccw spin.
Peak hold
Spectra for the azswings (top)
For each CW or CCW azswing
- a peak spectra was computed (max value in each freq channel
for the swing).
the plots show the peak hold
spectra for each swing (.ps) (.pdf)
- Each page is a separate az swing.
- Black is the peak hold spectra for the CW swing. Red is the
spectra for the CCW swing
- The y axis is a log scale.
- the top frame shows the full scale.
- the bottom frame blows up the vertical scale.
- 4200 MHz is the upper cutoff for the micro wave point to point
link band.
Average birdie power vs
azimuth. (top)
From the peak hold spectra, a number of frequency
ranges stick out. The average total power over these frequency
ranges was computed and then over plotted for each of the azimuth
swings. When multiple swings overlap in azimuth, the
transmission is coming from a fixed direction (and is not very time
variable). The azimuth used is from the azimuth encoder, it is not
necessarily the
heading for the transmission (it depends on how it scatters into the
dome optics).
plots of average rfi
power vs azimuth for different rfi bands (.ps) (.pdf):
- The table below summarizes the 5 frequency ranges.
- The wide bands may include more than 1 transmitter.
freq
|
bw
MHz
|
dome
azRange
|
Notes
|
4000-
4200
|
200
|
-55 to +12
add 180deg
125 to 192
|
This is part of the micro
wave link band.
Transmissions should be 20 MHz each.
az position is repeatable
|
4250-
4350
|
100
|
random
|
The az location is not repeatable.
This covers the radio altimeter band used by airplanes
|
4500-
4700
|
200
|
-30 to -5
add 180deg
150 to 175
|
az position is repeatable
probably also part of 4750-4800 mhz
|
4750-
4800
|
50
|
-8 to -3
add 180deg
172 to 177
|
az position is repeatable.
This may be part of the 4500-4700 MHz rfi.
|
4910-
4920
|
10
|
125 to 135
add 180deg
305 to 315
|
repeats in azimuth but
weak.
Looks similar to 10 MHz transmission seen before (at
different freq).
The 10MHz transmission are not decoded by our uni scanner.
|
Summary/ what they
could be. (top)
- the rfi hilltop monitor showed rfi at:
- 4035-4152 .. 30db above noise floor
- 4216-4326 .. 27db above noise floor
- 4451-4547 .. 10db above noise floor
- 4628-4700 .. 10db above noise floor
- 4752-4802 .. 1db above noise floor
- The levels are peak hold over 1 minute.
- 6 azimuth swings were done covering 4 to 5 GHz.
- Some of the rfi was extremely repeatable in azimuth.
- this implies the signal is stationary on the ground
- it is not time variable.
- The following rfi needs to be resolved:
- FCC frequency allocation
table for 3500-5000 MHz (.pdf) (downloaded
27feb19)
- 4000-4200 MHz: this is part of the point to point
microwave link band. (more
info)
- The gregorian dome az of the rfi was: -55 to +12.
- peaks at -48 and +11 gregorian azimuth.
- peaks at [132,191] if you add 180 degrees.
- prtc tower east of jayuya is the only FCC licensee i found
in pr covering 4000-4200 MHz. (location)
- it has a bearing of 121.5 degrees from AO (via google
earth).
- This is about 11 degrees from the gregorian az + 180.
- The peak at gregorian az bearing of -48/132
- 132 is close to the cerro punto tower (or the 3
towers east of cerro punta). (location)
- the FCC data base does not show them as using the
4000-4200 MHz band.
- 4250-4350 MHz . rfi that does not repeat in azimuth
- The 4250-4350 plane radio altimeter band could be the source
of this rfi (more info).
- You would expect it to not repeat in azimuth (since the
planes are moving).
- Looking at the hilltop monitor spectra, it looks like the
4000-4200 Mhz rfi.
- We need more investigation to determine if this is a land
based xmiter or not.
- 4500-4700 MHz.
- occurs at az of -30 and -8 deg. adding 180 degrees
gives az 150 and 172.
- the closest tower to 172 degrees is the tower east of
yiyi avila's tower (it is at 176 deg) (location).
- The FCC non federal allocation is fixed-satellite (space to
earth). I don't think this would have a fixed azimuth
location.
- I wonder if this could be an modulation production of
some other microwave link transmissions (6GHz, 11GHz)..
- 4750-4800 MHzMhz.
- Also peaks at -8 deg gregorian az.
- May be part of the 4500-4700 signal,
- It is much stronger than the other signals in the dome
signal. It did not appear as strong in the the rfi hilltop
monitor data.
- This was also seen in all of the previous azimuth swings
done in 2016 (links)
- 4910-4920 MHz.
- 10 Mhz band that peaks around 130 deg azimuth.
- Narrow band signals like this have been seen in previous
measurements.
- To do:
- the 4500-4800 MHz rfi should be further investigated.
- I don't see any FCC licenses for these freq range in p.r no
federal (except space to earth)
- It also seem to be stable in time and direction...
it's been around since at least 2016
processing:
x101/190207/azswing_cb/cbazswingrfi.pro, mk1band.pro
azswing_cbplot.pro
rfi measurements
home
home_~phil