exhibit
|
description
|
plots/
image
|
date
|
globe
display
|
- mock spectrometer. 5 x 1.6 MHz by 8192 channel
bands centered at:
- 1217.6,1339.4,1461.2,1583.0,1704.7
- This is the comb seen in the spectrum analyzer
data.
- 1 second dumps, 195 hz resoloution
|
|
160518
|
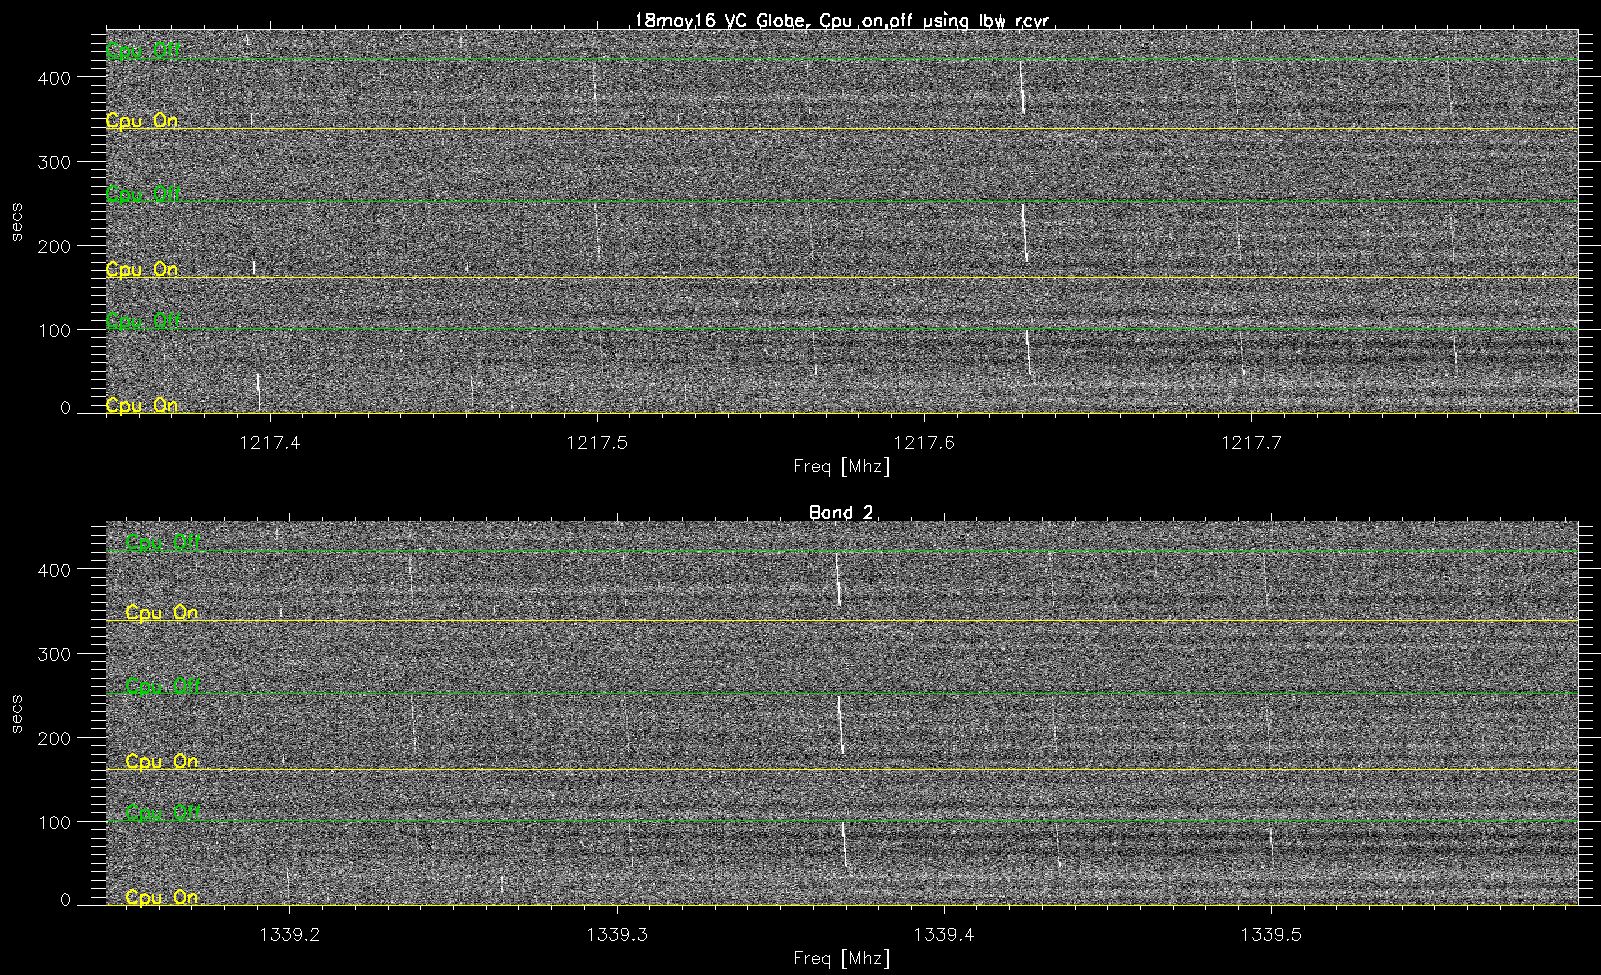
dynamic spectra lband
- processing: flatten image with median off spectra.
1.6 MHz bw, 8192 channels.
- Top: 1217.6 MHz band
- Bottom: 1339.4 MHz band
- didn't see anything in the 1461,1583 and 1704 mhz
bands
- The yellow lines show when the cpu was turned on,
green lines show when the cpu was turned off.
- The tone drifts by 2 to 3 khz in about 1 minute
(after turn on).
- There is a delay in the rfi appearing after turn
on.
- The birdies are spaced by about 65 khz.
|
.png
|
lband plots
- Page 1: average on,off spectra
- red cpu On, black: cpu Off (off overplots on).
- Top: 1217.6 mhz band
- Strongest birdie: 1217.6307 MHz
- bottom: 1339.4 mhz band
- Strongest birdie: 1339.3937 (near DC).
- Page 2: blowup of strongest birdies
- The width is caused by the frequency drift.
- The veritical scale is Tsys (in 195 hz
channels).
- Page 3:Plot birdie channels vs time
- top: 1217.6307 birdie (avg about 2khz about
birdie center)
- bottom: 1339.3937 birdie (avg about 3khz about
birdie center)
- The cpu on, off times are flagged. You can see
the delay from cpu turn on to birdie appearance.
see also:globe
rfi measured using the spectrum analyzer
processing:x101/160518/rfiVc_globelbw.pro
|
.ps
.pdf
|
atmradar
display
|
- lbw with cfr of 1485.4 MHz
- This is the stronger tone seen in the spectrum
analyzer data.
- mock spectrometer with:
- 4.3 mhz bw, 8192 channels, 1 sec dumps.
- Turn the cpu (controlling the large display) on
and off.
|
|
160509
|
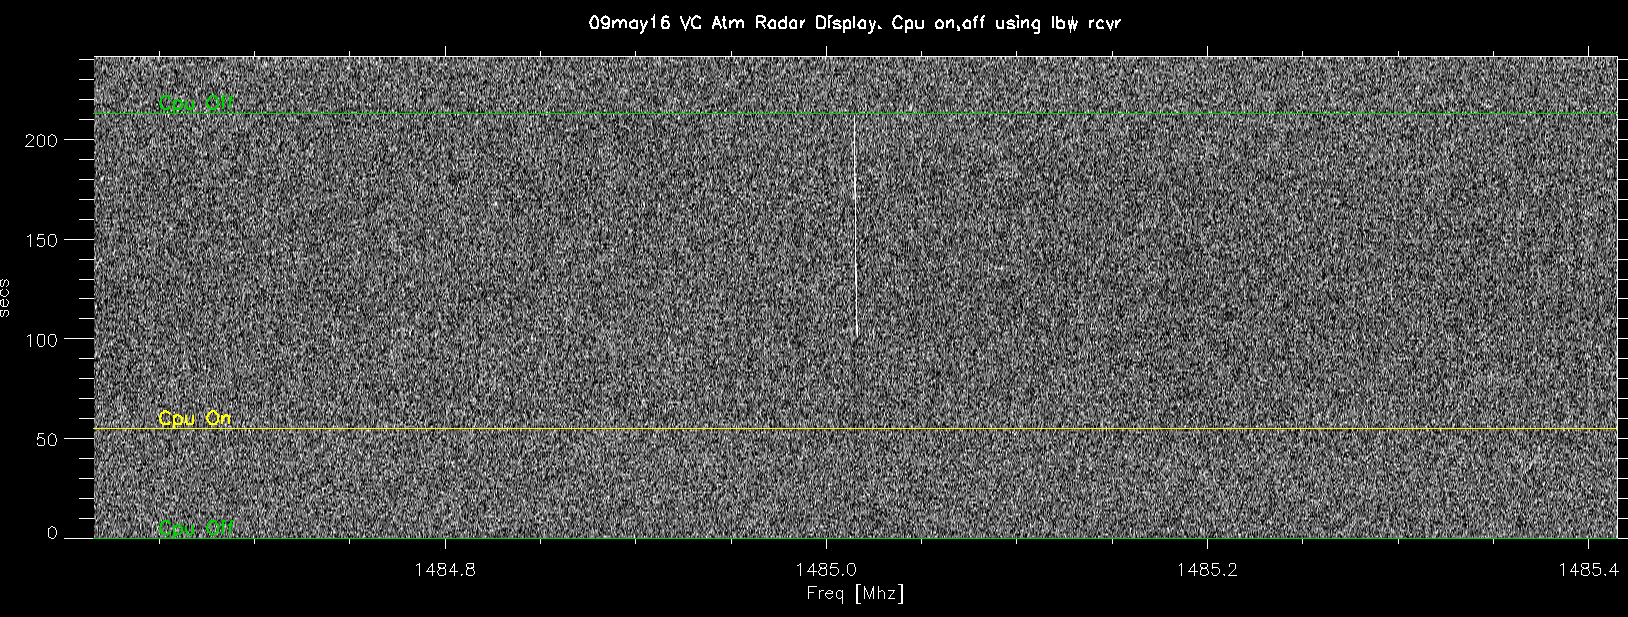
lband dynamic spectra
- processing: flatten with the median of spectra
- The green lines are cpu off, the yellow lines are
cpu on.
- There is a delay of about 45 secs from cpu on to
the rfi appearing.
|
.png
|
lband plots of birdie
- page 1: average on,off spectra
- Top: on,off over plotted
- red: cpu on, black : cpu Off.
- the birdies around the band center are
baseband birdies from the mock spectromter (is
didn't use the digital mixer for this band).
- bottom: blowup of the birdie
- the birdie is at 1485.0156 MHz. We did not
resolve it in the 525 hz channel width
(which means it didn't drift much in the
110 secs the signal was present)
- Page 2: birdie power vs time.
- i averaged 3 channels centered on the birdie
- The colored lines show when the cpu was turn
off, on.
see also: atm
radar rfi measured using the spectrum analyzer
processing:
x101/160509/vc_exhibitsrfi/rfvVc_atmrdrlbw.pro
|
.ps
.pdf
|
make a crater
|
- mock spectrometer. 53 MHz,cfr=327,.1 sec
dumps,8192 channels
- felix plugged, unplugged the turntable motor while
data was taken
|
|
160518
|
|
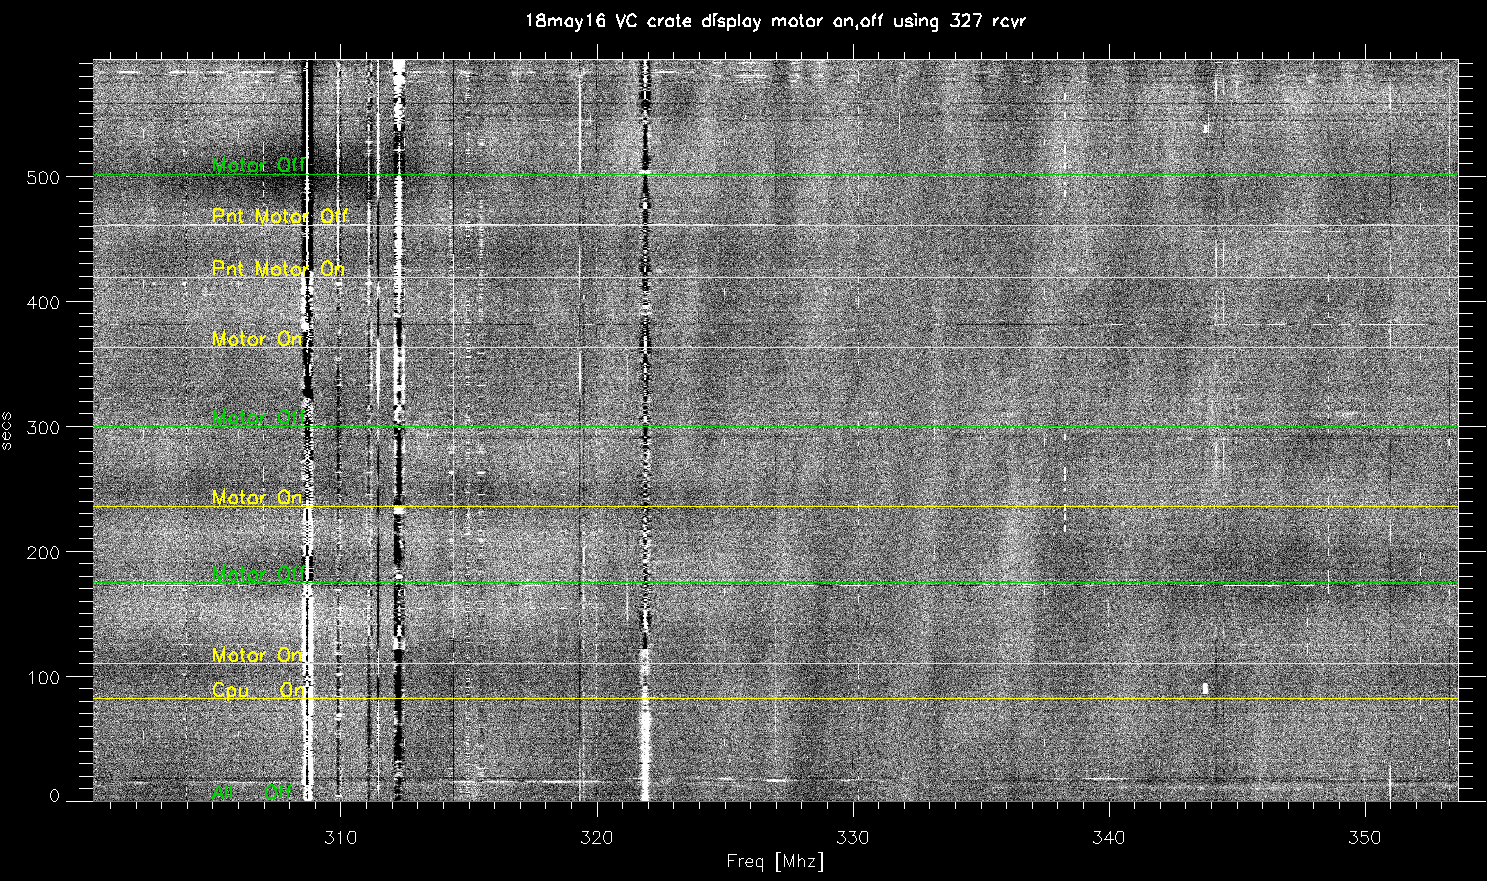
dynamic spectra 327:
- processing: flatten with median bandpass.
- green lines, things are off, yellow lines motor on
- The pointing motor was turned on,off at sec
420-460
- Nothing obvious jumps out of the image..
|
png
|
Plots of 327 results
- Page1: average spectra with motor on, off
- black is the average spectra while motor off
- red spectra is with motor on.
- I plotted the black trace on top of the red
trace.
- Each has about 300 seconds
- the baseline was removed using a 19th order
harmonic fit to the average spectra. The ripples
come from this fit.
- Page2: total power vs time:
- the power was averaged over 330.5 to 338 MHz
- The time resolution is .1 seconds
- I've flagged where the motor was turned on,off
- The noise doesn't change appreciably when the
motor is on.
See also: crater
rfi measured using the spectrum analyzer
processing: x101/160518/rfiVc_crater.pro
|
.ps
.pdf
|
track An
Asteroid
|
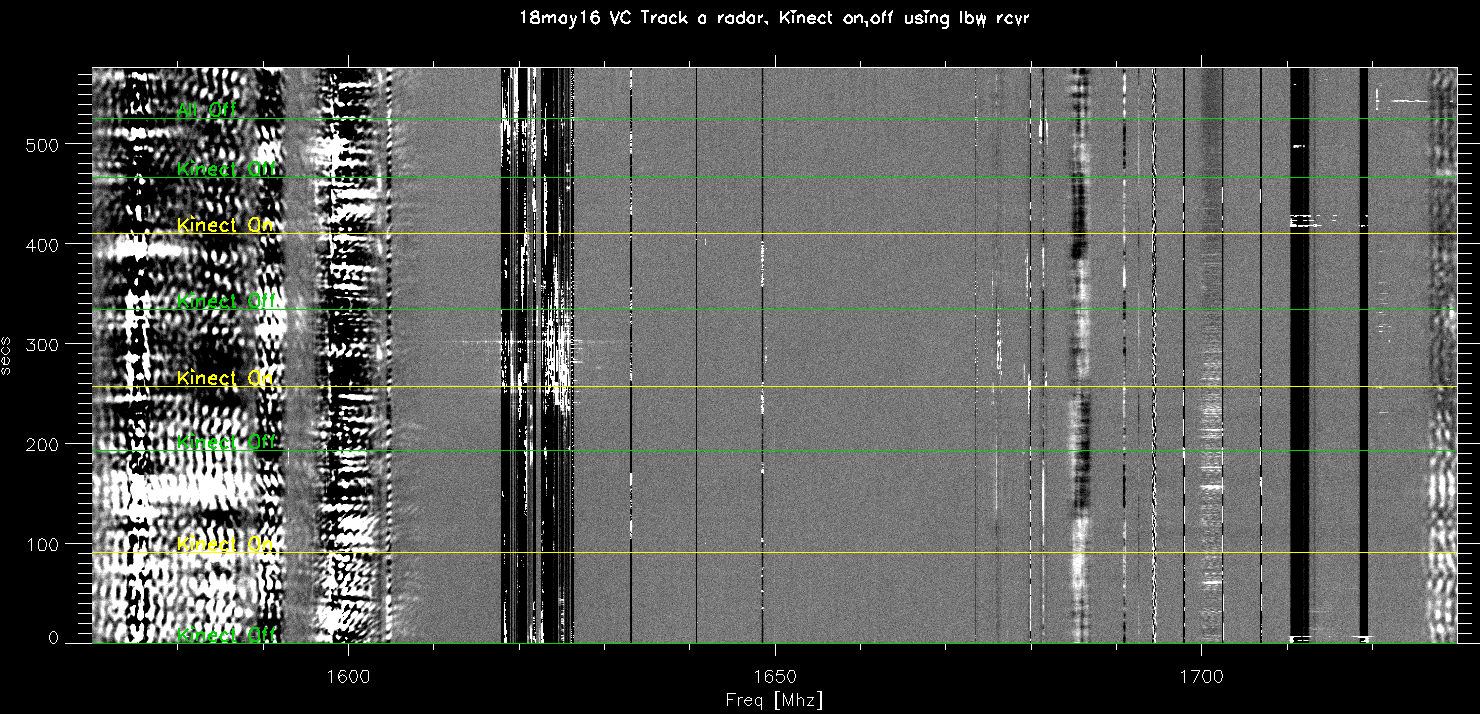
- 327: turn kinect on,off
- lbw: turn kinect on, off (2 wide bands, 1 narrow
band)
|
|
160518 |
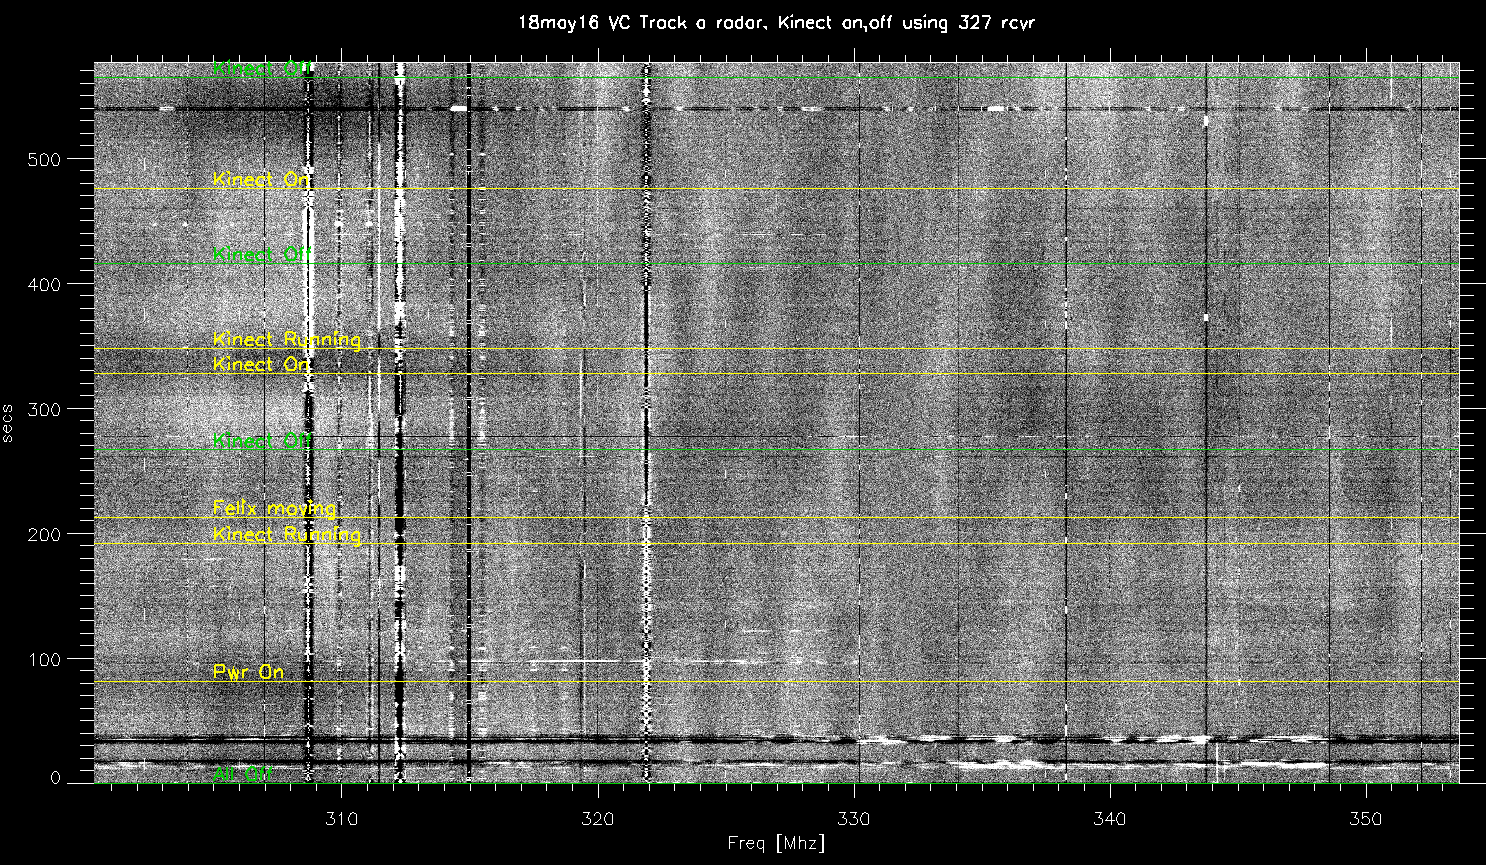
327 dynamic spectra
- .1 second integrations.
- The median spectra with kinect off was used to
flatten the image
- The green lines show when the kinect was unplugged
from the cpu
- the yellow lines how when the kinect was plugged
into the cpu.
- There is a delay from plugging in, to it being
active.
- Nothing obvious is seen in the on's vs the offs.
|
png
|
327 plots
- Page 1: average spectra with kinect plugged,
unplugged to cpu
- A 19th order harmonic was fit to the on and off
averages and then used to remove the filter shape.
This caused the ripples you see in the spectra.
- black: kinect unplugged, red kinect plugged in.
The cpu was left on.
- The 53 MHz band is split into 3 sections.
- nothing obvious between on,off. The dynamic
spectra shows that some of the on spikes are just
random during the on.
see also:
track an asteroid rfi using the spectrum analyzer
processing:processing:x101/160518/rfiVc_kinectl327pro |
.ps
.pdf
|
lbw dynamic spectra
- 1 sec, 160 MHz dumps taken at 1550, and 1650 MHz.
- The 1550 MHz had too much rfi to use
- the green, yellow lines show when the kinect was
off,on.
- nothing sticks out of the on,offs.
|
.png
|
lbw plots
- Page 1: average spectra with kinect plugged,
unplugged to cpu
- I used the 160 MHz band centered at 1650 MHz
(same as image)
- A 19th order harmonic was fit to the on and off
averages and then used to remove the filter shape.
This caused the ripples you see in the spectra.
- black: kinect unplugged, red kinect plugged in.
The cpu was left on.
- The 160 MHz band is split into 3 sections.
- nothing obvious between on,off. The dynamic
spectra shows that some of the on spikes are just
random during the on.
- Page 2: total power average (1650.1 to 1670 MHz)
vs time
- Data was sampled at 1 second time resolution
- The kinect on,off are flagged.
When data was taken with the spectrum analyzer, it
looked like the kinect rfi might be sweeping through the
band. Nothing seen in 327 or lbw receivers.
see also:
track an asteroid rfi using the spectrum analyzer
processing:x101/160518/rfiVc_kinectlbw.pro
|
.ps
.pdf
|
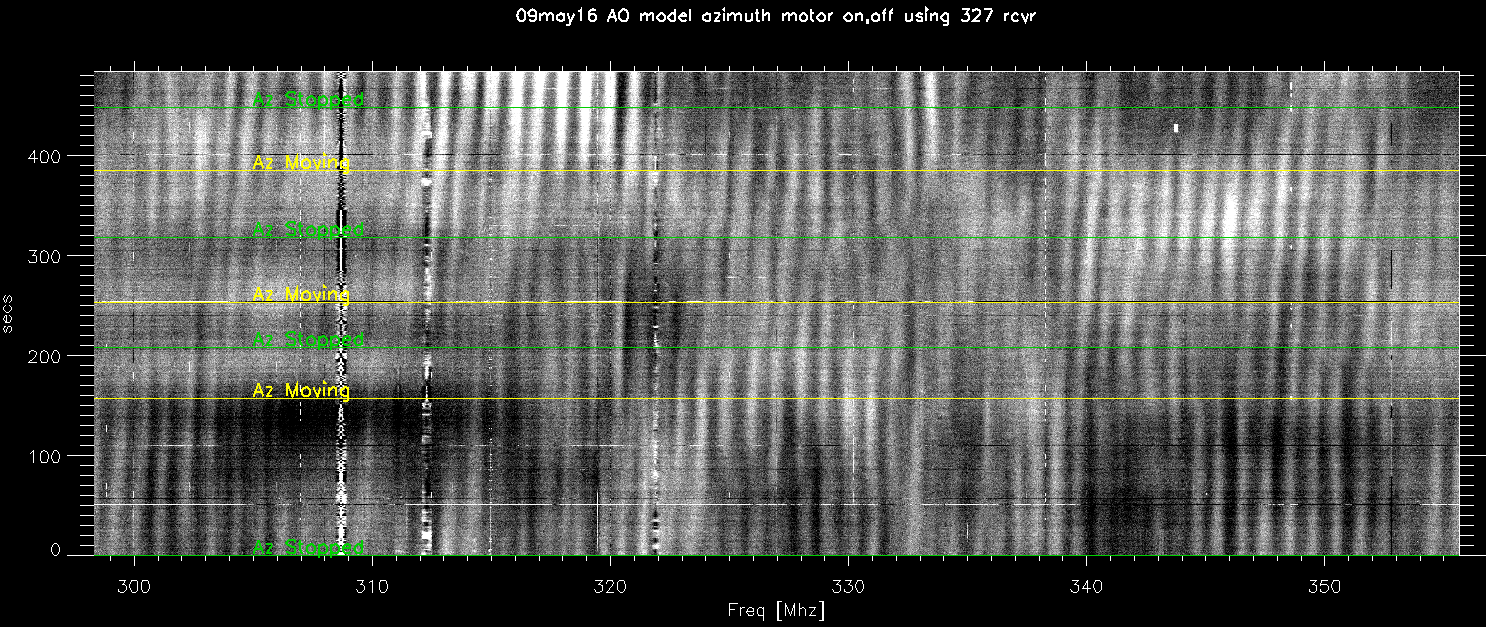
ao model
azmotor
|
- 327 receiver
- mock spectrometer, 53MHz bw, 8192 chan, 1
sec dumps
- start and top moving the the azimuth motor
- data was taken near noon, lots of 1 MHz standing
waves from sun.
|
|
150509
|
dynamic spectra 327
- 1 second integrations
- green,yellow lines show motor stopped, moving.
- ripples across band are 1 MHz standing waves from
the sun.
- Can't see any difference motor stopped,moving.
|
.png
|
327 plots
- Page 1: average spectra with az motor moving and
stopped
- A 19th order harmonic was fit to the on and off
averages and then used to remove the filter shape.
This caused the ripples you see in the spectra.
- black: motor stopped, red motor moving.
- The 53 MHz band is split into 3 sections.
- nothing obvious between on,off. The dynamic
spectra shows that some of the on spikes are
probably from the standing waves changing.
see also: ao
model az motor rfi using the spectrum analyzer
processing:processing:x101/160509/vc_exhibitrfi//rfiVc_aomodel327pro
|
.ps
.pdf
|
|
|
|
|