Discone antenna at 12meter.
last updated 25may21
Links
what we are trying
to measure
system description
system measurements
20 - 80 MHz rfi
400-800 MHz rfi
0 to 3GHz measurements
What we are trying to measure.
We are trying to characterize the rfi at the
12meter site for various reasons:
- 400 to 800 Mhz.
- What portion of the band is clean.
- This needs more sensitivity. The actual total power value is
not needed
- So we use 1Khz rbw *1001 over 10mhz spans. so mutiple
rbw are being thrown into each bin.
- 0 to 3ghz band
- A cooled wide band receiver is being developed for the
12meter. 2.3 to 14 ghz
- we need to know the total power levels so the lna won't
saturate.
- measuring weak signals is not a priority
- 20 to 80 Mhz (need to add to web page)
- Can we use a low frequency feed suspended from the 305 meter
towers.
- This probably wants sensitivity (although the sky temp is
pretty high).
- But we need to make sure we don't saturate the system.
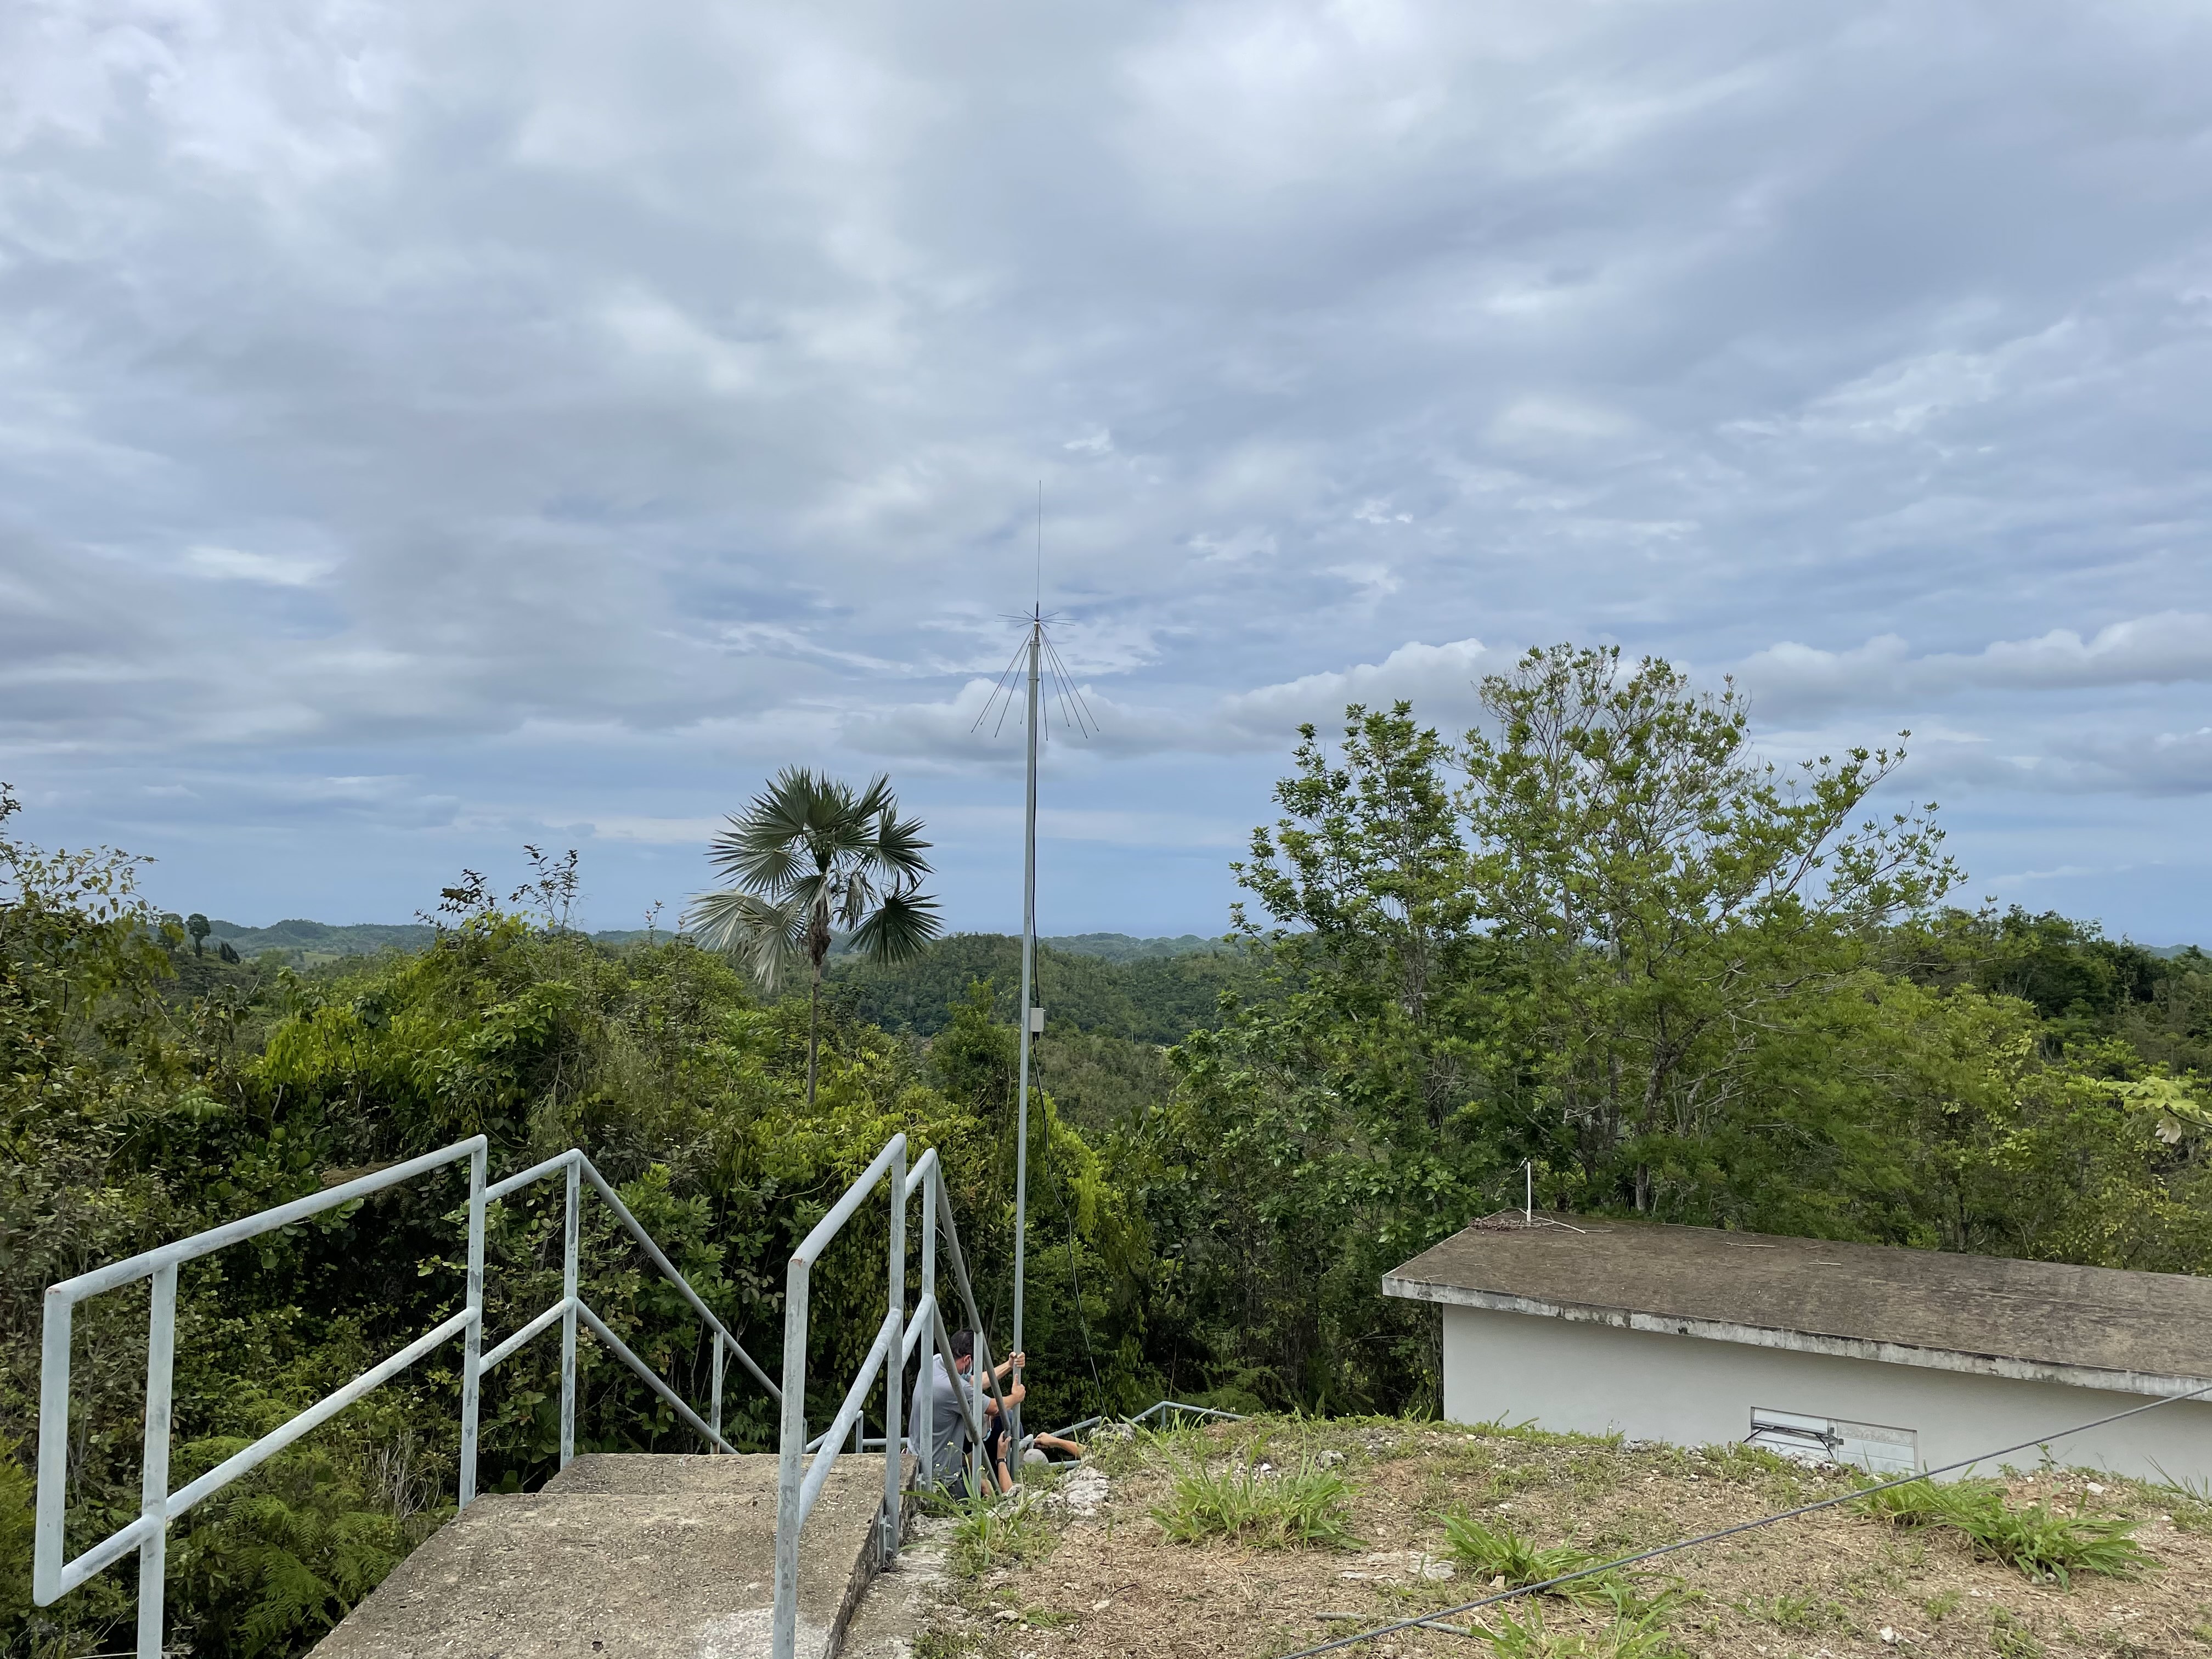
System description:
As discone antenna located at the 12meter site is
being used for rfi measurements.
Location:
- The photo shows the location of the discone (.jpeg). The
photo it looking north from the 12meter base 12meter.
Discone antenna:
We are using a diamond d3000N discone antenna
(.pdf)
- 25 MHz to 3 GHz with a nominal 2db gain.
System design:
The antenna system consists of:
discone ->cable1 -> amp1 -> cable2 -> fieldfox
9916A signal analyzer.
- The discone sits on a 20' mast
- Both cables are low loss (..)
- cable1 is about 8 feet long
- Amp1:
- This is sitting on the pole holding the discone antenna.
- ZX60-4016e-S+ (datasheet)
- 20MHz to 4 GHz (we are using it 20 to 3GHz)
- gain: 20 to 16db (20MHz to 3GHz)
- NoiseFigure: 3.78 to 4.0 dbm (20MHz to 3 GHz) (408 to 438 K
at amp input)
- vswr: 1.3 to 1.4 (input)
- Cable2
- FieldFox 9916A signal analyzer sensitivity (-20dbm ref
level, 0db atten).
- i ran the field fox with peak (rather than rms detector) so
the power measurements may be a few db too high.
- no Preamp
- -137dbm/hz (1.25e6 K)
- 2MHz to 4.5GHz (2.1 to 2.8GHz differs)
- -133dbm/hz (3.63e6 K)
- with 20db preamp
System measurements:
- System response
(.ps) (.pdf)
- S21 from 8' cable -> amp1 -> 50' cable was measured.
It was used to correct the measurements to the output of
the discone antenna.
- Top: s21 and amp1 gain 0 to 3 ghz
- middle: cable loss (both cables)
- This just subtracts s21 from the gain.
- about .7db at 100 MHz
- 5.2 db at 3000MHz.
- bottom: example of correcting fieldfox spectra with s21
- Black: measured by Fieldfox
- red: after subtracting S21.
- Since the noise floor is being set by the fieldfox,
subtracting S21 will not really reduce it .
- Can amp1 saturate ?
- Field fox settings used for measurements.
- The minimum noise floor is achieved with:
- atten=0
- preamp on
- minimum resolution bandwidth (rbw)
- We needed to be careful not to saturate the FF with the FM
band.
20 to 80 MHz rfi measurements
Data was taken in the 20 to 80 MHz band range
on 12may21. The setup was:
- 12may21 16:20 to 13may21 15:01
- 20 to 80 Mhz in 6 10Mhz steps
- The discone sheet says that the discone goes from 25 to 3000
Mhz. 20Mhz may be a bit degraded.
- 10 Mhz span, 1KHz rbw, 1001points, peak detector, 0 db
attenuation, preamp on.
- sweep 20 times at each 10Mhz
- compute avg of 20 sweeps
- compute pkhold of 20 sweeps.
- 1001points*1Khz = 1Mhz. with 10Mhz span, about 10 measurements
were combined for each output channel. Using peak detector, this
takes the maximum of the 10 values. The value will be higher
than the true rms power by about 5db (I switched between the 2
detectors with a 50 ohm load).
measured 20 to 80
MHz rfi (.ps) (.pdf)
- Page 1: spectra and total power
- top: example spectra (1 20 sweep avg)
- black: value read back from field fox
- green line: noise floor of analyzer. this was measured
with a 50 ohm load on the analyzer input.
- The avg signal was above the analyzer noise floor
for then entire band.
- red: removing S21 to get values at output of discone.
since the noise floor displayed was above the analyzer noise
floor, this will be the noise floor at the output of the
discone.
- The 6.78 MHz standing wave corresponds to 150/6.78=22
meter distance. If the velocity in the cable is .7 this
gives 15.49 meters or about 50ft. The cable between
the field fox and the amp at the discone is about 50 ft. We
could get rid of this by putting an attenuator in the line,
but this would degrade the sensitivity.
- Bottom: total power vs time
- The x axis is hour of day form 12may21.
- black is the value from analyzer, red should be that at
the output of the discone.
- things pick up round 11am (hr 35). dynamic spectra
show this to be rfi at 55 MHz.
- Page 2: over plot hourly spectra
- An hourly average was computed for the 20 sweep avg spectra
and the peak hold spectra.
- Top: the hourly average of the average spectra
- Bottom: the hourly average of the peak hold spectra
- These spectra have has s21 removed (so they should reflect
the output of the discone).
- Page 3: rms/mean by channel for all data (using the 20sweep
averages).
- the rms for each freq channel was computed and then divided
by it's mean value.
- This should match the radiometer equation if there is no
drift in the electronic gain.
- deltaTsys/Tsys=1/sqrt(bw*tau)
- bw= 1Khz
- tau:sweep time=.7 seconds, 1001 points, 20 sweeps were
averaged..
- tmPoint=.7/1001*20 = .014 seconds
- expectedRms= 1/sqrt(1000*.014) = .287
- measured value (median): .116
- the ratio Expected/Measured= 2.3
- ratio^2 = 5.29
- so the bw*time product needs to be 5.29 time larger ???
Dynamic spectra
Dynamic
spectra of spectra in log (db) scale (.gif)
- The standing wave dominates the image.
Dynamic
spectra (avgspectra) with a linear scale after normalizing
to the median value (.gif)
- I've divided each frequency channel by its median value.
This gets rid of the amplitude ,but it gives you a more
sensitive look at the variation of the rfi.
- You can see bands that are in use (eg 27-30MHz, 31-37MHz, etc)
Dynamic spectra
(PkHoldSpectra) with a linear scale after normalizing to the
median value (.gif)
- The rfi sticks out a little better with the peak hold
(though the noise floor will be a bit higher)
processing:x101/210512/rfidiscone.pro
400 to 800 MHz rfi measurements
Data was taken in the 400 to 800 MHz band range
on 14may21 thru 17may21. The setup was:
- 14may21 17:10 to 17may21 11:00.
- 400 to 800 in 40 10 MHz steps
- 10MHz span, 1Khz rbw, 1001 points, peak detector, 5db
attenuation, preamp on
- record spectra after averaging 20 sweeps, as well as the peak
hold spectra for the 20 sweeps.
- It took about 20 seconds to complete 1 10MHz band (mainly
writing to disc)
- the 40 steps from 400 to 800 MHz took about 13 minutes.
measured 400-800 MHz
rfi (.ps) (.pdf)
- Page 1: spectra and total power
- top: example spectra
- black: value read back from field fox
- red: removing S21 to get values at output of disccone
- (note the noise floor probably wouldn't move
down since it is set by the field fox).
- green line: noise floor of analyzer (-153 dbm/hz + 1Khz
rbw). This assumes 0db attn. or 5db attn will raise it by
around 5db. Using the peak detector rather than rms avg will
also raise it a few more db)
- The 6MHz wide rfi's are mainly digital tv Stations.
- The stations have a narrow stronger spike on one edge.
For weaker stations you tend to only see this spike.
- middle: total power vs time
- The x axis is hour of day form 14may21.
- black is the value from analyzer, red should be that at
the output of the discone.
- Looks like there is a dip in the power each day.
- Bottom: over plot total power from each day
- The 4 colors plot the data from each day.
- There is a gradual dip in the power starting a little
before midnight (AST), hitting a minimum at 4am, and then
coming back up at around 10am.
- The dashed lines show the lst for these days.
- The galaxy passes overhead (dec=18) around 19hours
lst.
- It could have been the galaxy since the discone can not
see straight up.. but we should then see a dip when
the galaxy sets..
- From 12am to 6am the temperature is probably
cooler.. but you'd expect and amps gain to increase with
lowering temperature ???
- so it's a bit of a mystery.
- Page 2: over plot daily spectra
- A daily average was computed for the 20 sweep avg spectra
and the peak hold spectra.
- Top: the daily average of the average spectra
- Bottom: the daily average of the peak hold spectra
- These spectra have has s21 removed (so they should reflect
the output of the discone).
Dynamic spectra
Dynamic
spectra of spectra in log (db) scale (.gif)
- The rfi is pretty saturated. The vertical columns are
mostly digital tv stations.
Dynamic
spectra linear scale after normalizing to the median value
(.gif)
- I've divided each frequency channel by the median value.
This gets rid of the amplitude ,but it gives you a more
sensitive look at the variation of the rfi.
- Looks like the only free space is 610 to 620 MHz. This is
channel 37 (allocated to radio astronomy) and the adjacent
channel 38.
processing:x101/210514/rfidiscone.pro
Data was taken with the discone and field fox
spectrum analyzer covering 0 to 3 GHz on multiple days.
The setup was:
The table lists the data that was taken
- The plots contain:
- Page 1:
- top:example spectra. Black is measured by analyzer, red
has the S21 of the cables. preamps removed (so you are
at the output of the discone.
- bottom: total power vs time. Just sum the channels. Black
is the analyzer value, red is after removing S21.
- Page 2: spectra avged to 1 hour
- top: recorded avg sweep spectra (after removing S21)
- bottom:recorded peak hold spectra then averaged to 1 hour
- The green line is the field fox noise floor (without S21
removed).
Jumps
We see a number of jumps in the total power in
the data. The total power measurements cover 0 to 3GHz which
consist of 10 16 sec acquisitions (so they don't occur
simultaneously).
the plots
show two of these jumps on 19may21 (.ps) (.pdf)
- Page 1: jump at 10.7 hours.
- This is a single jump up then back down
- Top: the total power jump
- middle: The spectra before and at the jump
- bottom; the size of the jump (in db)
- Page 2: jump at 12.5 hours
- The power jumped up by 8db and stayed there for about 30
minutes.
- top: total power jump
- middle spectra before and after jump
- bottom. the size of the jump for 12.5 (green) and the size
of the jump at 10.7 over plotted (red)
Properties of the jumps:
- The noise floor does not change.
- so this is probably not the preamp being switched in and out
by accident.
- Gain changes in the amp out on the discone would not change
the noise floor (since the floor is being set by the
fieldfox).
- The 1950 MHz cell band rfi did not change its strength
during the either of the jumps.
- Most of the changes came in backs < 1100 MHz.
- There were no jumps in data taken with 5 or 10db
attenuation
- This is probably related to saturation
- since we don't see it with 5 or 10db attenuation.
- But we did see it with 0 db attenuation with no preamp. So
when we turn on the 20 db preamp, it should have
saturated more often ???
- The power levels:
- -20dbm before jump at analyzer
- this had the 20db preamp on , so the mixer in the
analyzer saw 0 dbm
- The reported value is at the input port.. they remove
the preamp gain.
- The amp1 output at discone had
- -40dbm at input, -20dbm at output (since most of the
signal is at the fm band where this is very little loss
in the cable.)
- This is far from it's compression level.
- -13db after jump
- analyzer mixer saw +7 dbm
- amp1 at discone has -13dbm out, -33dbm input.
- The only problem with blaming this on saturation is:
- the spectra definitely look worse when it jumps ups
- when you saturate, the power levels in the strongest rfi
should go down (since you hit the voltage rails)
- What is causing the power to jump up. I don't see a
unique rfi that has gotten stronger.
- My guess is that the spectra when the jumps are low are
the correct spectra.
processing: x101/210519/rfidiscone.pro.
rfi measurements
home.
home_~phil