Monitoring the aux cables and towers.
27oct20
Intro
WJE installed monitoring equipment on the 305
meter telescope on 12oct20. As of 27oct20 they are monitoring:
- Cable temperatures:
- At the towers:
- auxmain cables
- auxbackstay cables
- At the anchors: (as of 27oct20 data not yet available for
download)
- T12 backstay auxcable west
- T4 backstays auxcable north
- Tilt sensors:
- At the towers
- tilt sensor aligned with the radial direction of the
cables
- tilt sensor aligned perpendicular to the radial direction
- Strain measurements
- vibrating wire strain gauges
- At the towers:
- 2 strain gauges are connected on each side (horizontal) of
each aux cable socket
- to measure cable slippage from socket:
- lvdt connected between cable socket and cable
- T12 aux backstay west
- T4 aux backstay north
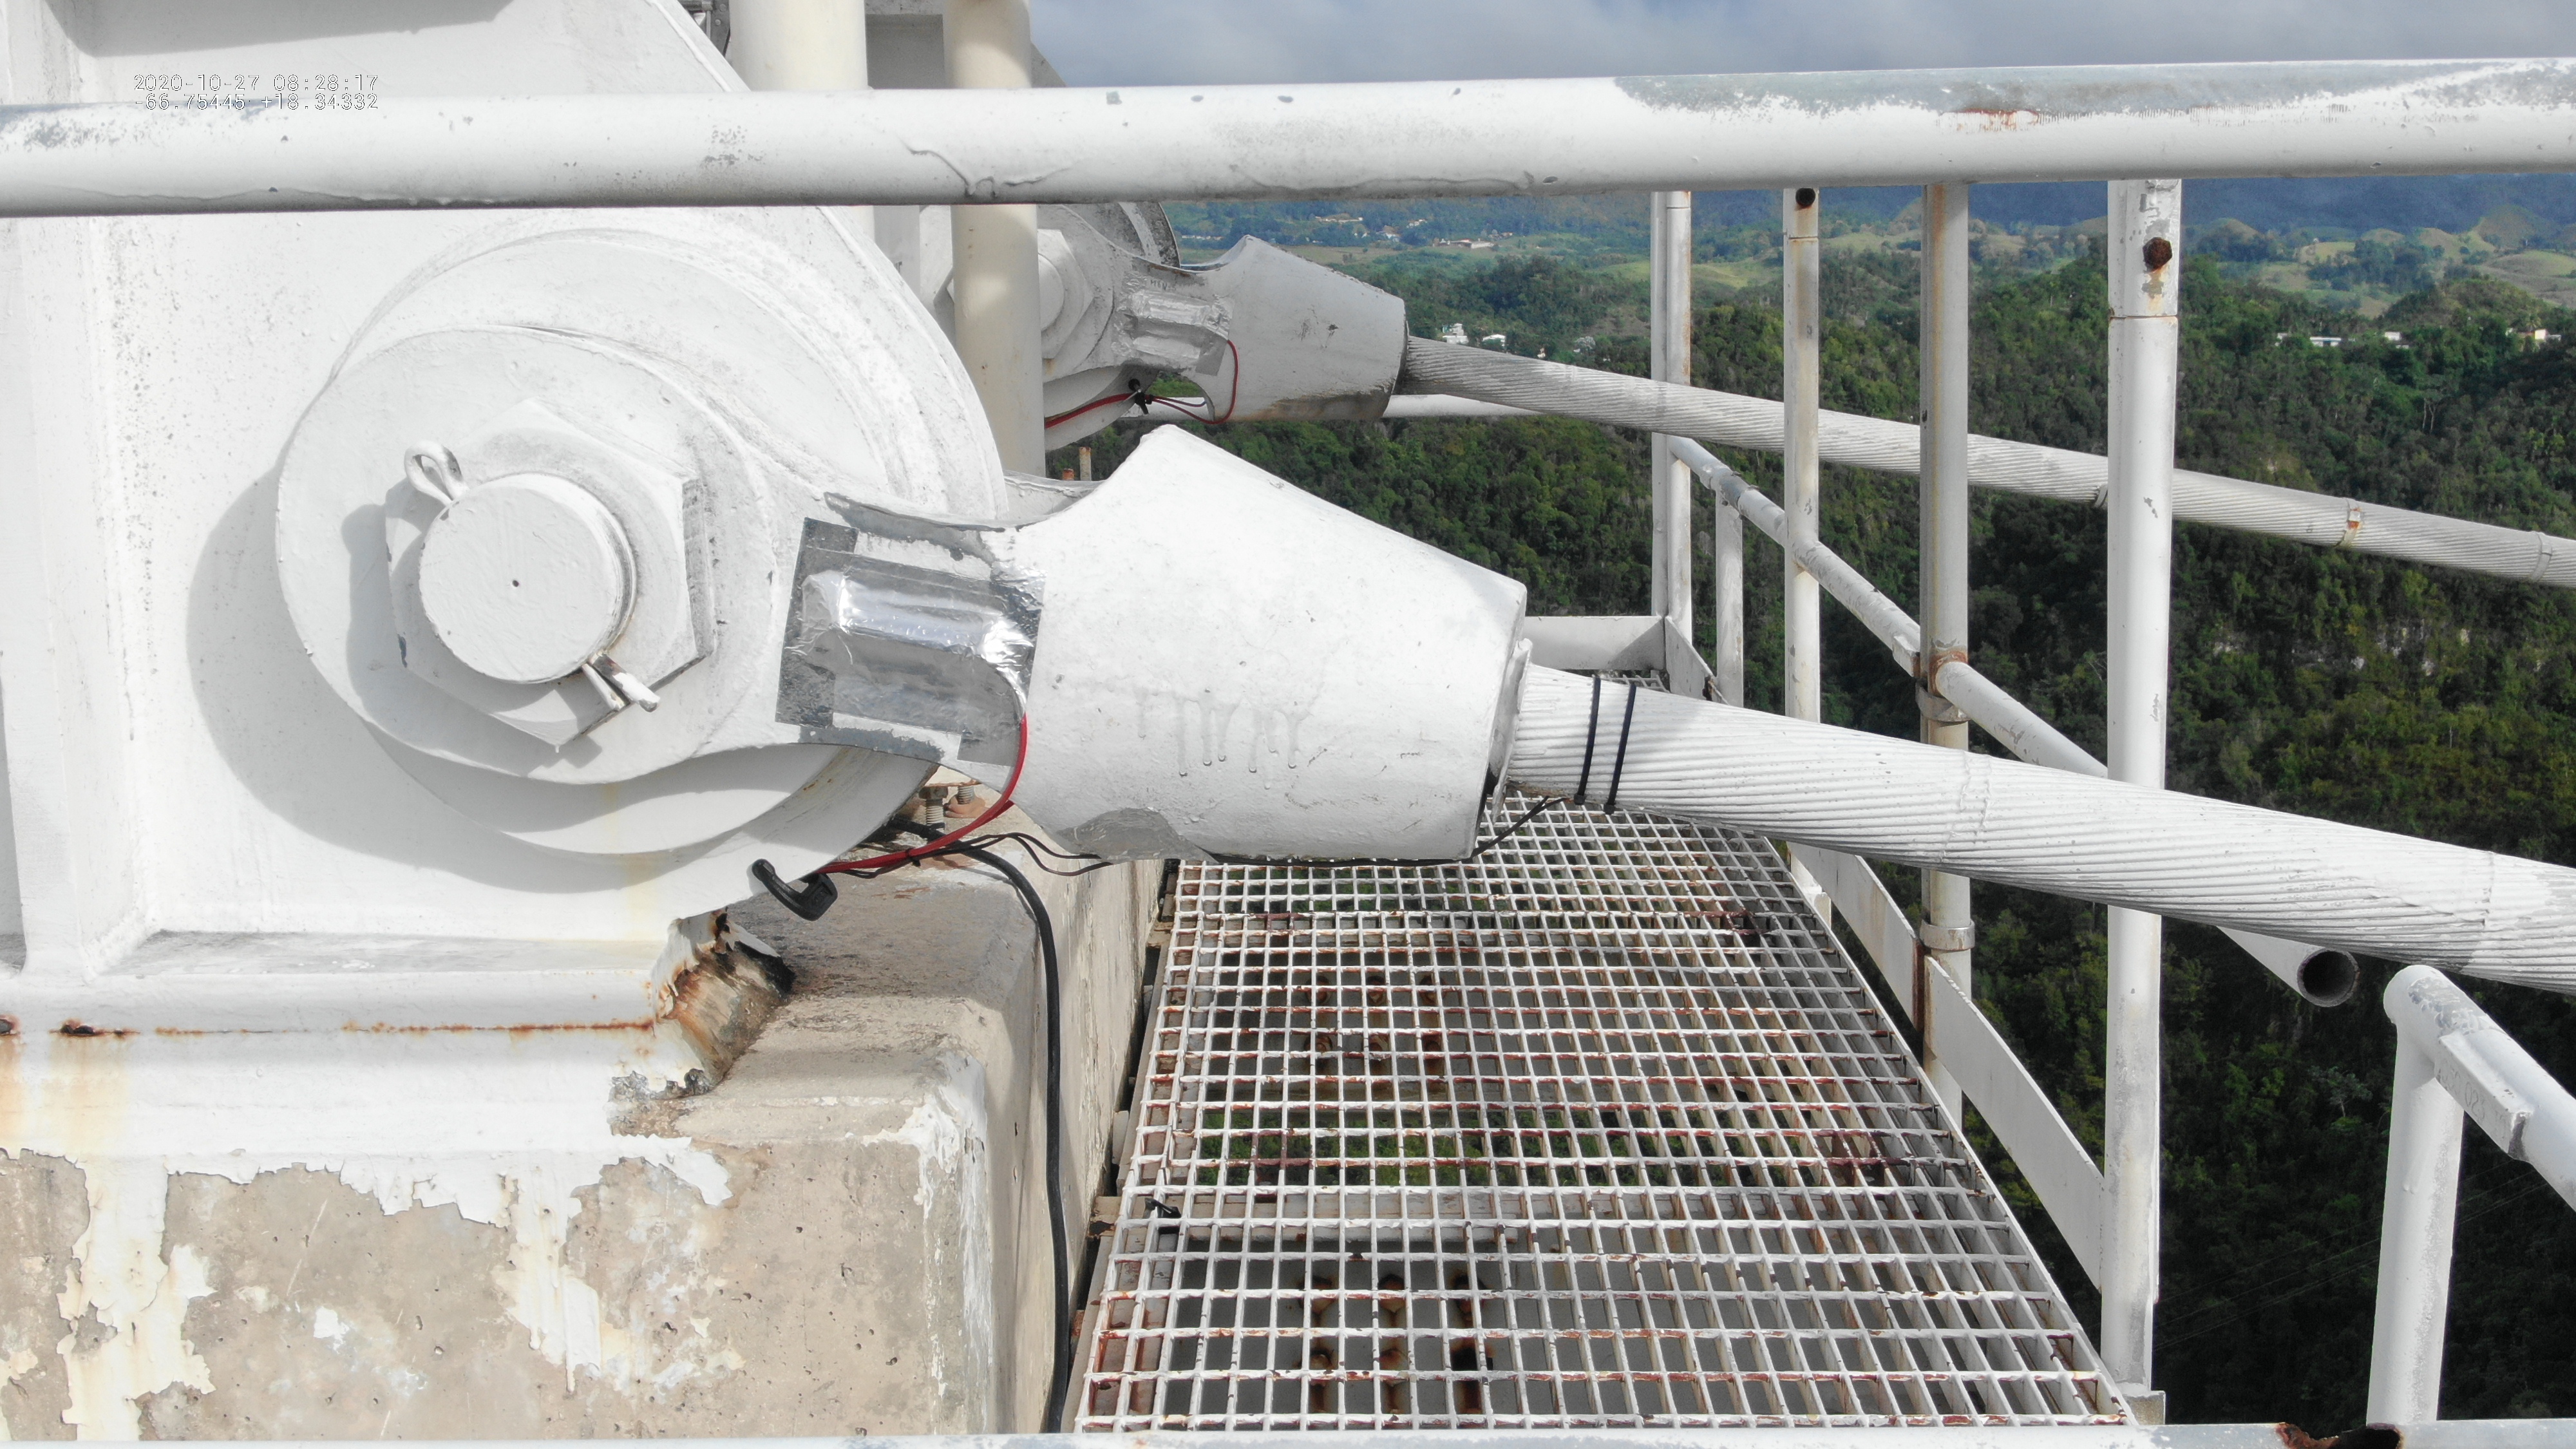
- Photo
showing temp sensors and strain gauges mounting (.jpg)
- this is on top of tower 8. You see the platform aux cables.
The drone is in the south looking north
- The closest cable is T8platformaux south
- The aluminum tape is covering the strain gauge.
- Each socket has a strain gauge on each side (you can see
the opposite side gauge on the far cable)
- The black bands around the near cable hold the temperature
sensor under the cable.
- there is only 1 temperature sensor for a set of platform
or backstay cables
Acquiring the data:
- Data is sent via wire to a campbell scientific data logger
- There is a datalogger at the top of each tower, and at
T12 anchor and T4 anchor
- The logger then sends the data via wireless modem to a base
station (in phil's office)
- The antenna on top of tower 4 acts as a relay for the
station at anchor 4.
- The downloadable data is sampled at 1 minute intervals
- I need to find out the actual sampling rate and averaging
that is done.
- Manuals for the acquisition equipment:
- cr6 data logger
- rf451 radio
- FreeWave spread spectrum wireless transceiver (oem
board inside the rf451.. not sure of the model)
- The data is uploaded from the base station in phil's office to
the wje AO web page in chicago.
- You can access the data via their AO website.
- You can generate plots of the data
- You can also download the data in csv format for a user
requested date range.
- The lvdt is not yet available for download (27oct20).
The temperature data
- Plot the aux cable temperature data vs
date, hour (.ps) (.pdf)
- Colors label the cables
- Note that all temperatures are taken on the tower (platform
and backstay sides).
- Page 1: cable temperature vs daynumber of year
- Top: platform aux cable temps vs dayno
- Middle: backstays aux cable temps vs dayno
- Bottom: Tower PlatformTemp - Backstay temp
- for 12 and 8 the main and backstay temp is on the same
side: P12West -B12West,P8South-B8south
- for 4 : P4South - B4North (P4north failed)
- Tower 8 platform and backstay cable temps are noisier than
t12, and t4.
- Page 2: Cable temperature vs hour of day.
- Top: Platform aux cable temps vs hour of day
- Tower 12 has a few days with a large oscillation
- middle: backstay aux cable temps vs hour of day.
- bottom: Platform - backstay cable temps.
- Page 3: average cable temperatures
- The data from each day is averaged.
- During the morning:
- T12 and T8 main cables heat up before the backstays
- T4 backstay heats up before the main cables
- This is just the geometry of the cable and sun.
- You would expect that a temperature difference in the
main,backstay would be seen it the tower tilts (see below).
processing: x101/cables/wjepro/plottemp.pro
- Tower 8 and tower12 temperature
oscillations (.ps) (.pdf)
- Page 1: 12oct20,25oct20 platform and backstay cable temps
- The green T8 temps are noisier on 12oct20 and continue
noisy through the current date
- the Black T12 temps show an oscillation on 25oct20. the
started around 20oct20.
- Page 2: blowup showing T8 temp oscillation
- this is the first 100 minutes of 12oct20. The data is
sampled at 1 minute intervals
- The oscillation amplitude is +/- .5 deg F. The period is 8
minutes.
- The oscillation is in the platform and the backstay
data. It is probably a sampling or processing error.
- Page 3: fft of the temperature data showing oscillation
frequencies
- This uses 15 days of data.
- The green data peaks around 2.08 milliHz or 8 minutes. It
is present in the platform and backstay temps of T8
- You can also see a peak around .6- to .7 milliHz (24 to 28
minute period) in the T12 data (platform and backstay).
- Page 4: Tower 12 temperature oscillation
- data for 8am to 12pm is over plotted for 20-25oct20
- Top: T12 platform temps showing the oscillation during the
day
- Bottom: T4 platform temps for the same time period. No
oscillation.
- Page 5: blowup of T12 oscillation
- A linear fit was subtracted from the 8-12 data.
- top: T12
- on 23oct20 there were 10 periods in 4 hours
(24 minute period).
- the amplitude is up to +/- 2degF
- Bottom: T4 temps show no oscillation.
processing: x101/cables/wjepro/tempdiag.pro
- Histogram of cable temps shows dropouts
every .5 degF above 80F(.ps) (.pdf)
- The binsize of set to .1 deg F.
- Page 1: 70 to 95 degrees.
- There are no counts in a fixed spacing above 80 F.
- This is not seen below 73 F
- Page 2: Blowup 80 to 85 degrees
- The 0 count bins are every .5 degF
- This occurs for all temperature measurements
- I don't know the resolution of the temperature sensors
- If the data is being averaged over say 60 seconds, then you
would expect the resolution to increase.
- It's odd that this resolution limit is not seen on the low
side of the temperature range..
processing: x101/cables/wjepro/temphist.pro
- Rate of change of temp vs hour of day
(.ps) (.pdf)
- the temperature data was interpolated to 1 minute samples
(in case there was missing samples)
- The temperature rate was computed by subtracting adjacent
samples.
- Page 1: temp Rate vs hour of day 0-24 hours
- Black is the platform aux cables temperature rate.
- red is the backstay temperature rate
- The 3 frames are T12,T4, T8
- The digitization during the day may be coming from the
dropouts seen in the histograms above.
- The vertical spikes in T12 are the 24 minute oscillations
- The large spread in the T8 rates come from the 8 minute
oscillations.
- Page 2: blowup temperature rates 8 to 11 am
- Each day is over plotted in a separate color
- Each frame is a separate tower
- I've offset the Main +.5F/min and backstays
-.5F/min for display.
- Top: t12
- The large oscillations are the days with the 24min
oscillation
- Looking closely at AuxMainW there is a coherent
temperature rate oscillation 8am to about 9am
- I think this is a shadowing of T12AMainW by the other
T12 cables as the sun rises.
- As it moves up , each main cable can shadow the T12aux
for a short period of time.
- Middle T4; looks normal
- bottom:T8 : large from 8 minute oscillation.
processing:x101/cables/wjepro/temprate.pro
Temperature summary
- Temperature difference Platform - backstay
- T12
- T12Pwest is always warmer than T12Bwest.
- T4:
- T4BNorth warms much faster than T4Psouth
- around 9:30 am the trend reverses and the platform begins
to catchup.
- T8
- There is less difference in the T8 platform and backstay
cable temperatures.
- T8 temperature values have an 8 minute oscillation of +/-
.5degF.
- This is probably from the data acquisition (the actual
temperature is not doing this)
- T12: shows 24 minute oscillations during the day. starting
around 20oct20.
- Histograms of the data with .1 deg bin size show no counts
every .5 deg above 80deg
- If the data is being averaged for 60 seconds, this should
not occur.
- If the data is a single sample each 60 seconds then you
might expect this.
Tower tilts
- Tilt sensors on top of the tower measure the radial (in cable
direction) and transverse tilts.
- I don't know how accurately the sensors were mounted. There
may be a dc tilt from the mounting. It is probably best to look
at the change in tilt.
Plotting the tower tilts
vs date and hour of day (.ps) (.pdf)
- Page 1: tilts vs daynumber
- Each tower is plotted in a different color
- Top: radial tilts (positive is toward the platform).
- T12 tilt was drifting down until dayno 294 (20oct20) when
it stabilized.
- T4 has the largest change in tilt
- Bottom: Tangential tilts vs daynumber
- T12 is also showed in downward drift until 20oct20
- T8 tangential tilt does not register.
- Page 2: tilts vs hour of day
- Top: radial tilts
- T4 has the steepest decline in tilt
- T8 has very little change in tilt.
- bottom: tangential tilts
processing: x101/cables/wjepro/plottilt.pro
Plotting the radial
tower tilts vs the (main-backstay) cable temperature differences
(.ps) (.pdf)
- Each tower if plotted in a separate color
- The T12 data showed a drift in tilt.
- To correct for this, a linear fit was removed from all tilts
using data from 0-5am and 20-24 hours.
- Data from 6:30 to 10:00 hours were used for the main- backstay
temps.
- There is a clear correlation between the tower radial tilt and
the temperature difference of the main and backstay cables.
- Tower 4 has the largest temperature difference as well as the
largest tilt.
- Tower 4 tilt of .03deg is .128' or 1.5 inches at the
top of the tower if you use 245' for the height of T4.
- The 1960 drawings say the standard motion can be up to +/-
.1 ft.
- It looks like the sign of the radial tower tilt might be
reversed.
- Temp tower - temp Backstay < 0 --> the backstay
cables are hotter
- If the backstay cables are warmer, they should stretch more
and lower their tension
- So the tower should tilt toward the main cables (or
platform).
- The current definition of the tilts says a tilt toward the
platform if positive.
- We are seeing a negative tilt in the tilt data.
processing: x101/cables/wjepro/tiltvstempdif.pro
Strain gauge differences
Each aux socket at the platform has a strain
gauge on each side of the socket. The plots below plot the
difference in strain
vs various parameters.
Notes:
- When processing the data i've removed the original
strain gauge sample from each measurement set (so they all start
at 0).
- Plotting vs day, the x axis is labeled: yymmdd:hh
- The "all" plots clip the T4 platform diff's so you can't see
after the T4M break differences.. The "afterM4break" plots,
center the vertical scale on the larger difference.
Summary of things to look into.
Things to be looked into:
- T8 temps have an 8 minute +/- .5deg F oscillation
- T12 temps have a 24 minute +/- 2degF oscillation that started
around 20oct20
- With a histogram of .1 degF binsize, there are bins with no
counts every .5 deg starting at 80F
- If the data is being averaged, this shouldn't occur.
- Tower12 tilts were drifting until 20oct20
- Tower8 tangential tilts are all 0
- It looks like the sign of the radial tilts might be reversed.
home_~phi