08nov13 clp data with dome
08nov13
Links
The setup
datafiles recorded
Tx window
Tx window after adding samples to ipp
receive window
decoded spectra
Summary
Intro:
Coded
long pulse data was taken with the rdev spectrometer and the dome.
The setup:
- tx setup:
- dual beam with 800 kw to dome , 350 kw to ch
- dome moving .04 deg/sec between 5 and 19 degrees
(continual).
- az=270
- iflo setup.
- 430 -> 750 -> 260 -> 260Amp -> mixer (260 to 30)
-> 20Mhz bw 30Mhz filter -> rdev in other room
- @ 260 the IF is unflipped
- 260-> 30 mixer we found in the drawer.
- Used 290 lo (7dbm) so 30 Mhz IF is flipped
- had rms volts about 50 millivolts. for data
- Rdev setup :
- image:/pcmn/sasdr_image333.gz
- 140 MHz clock.
- config file:pnet.conf.fir35M_20131108
- tx samples a/d 1
- rx samples a/d 2
- dec_f=1 35Mhz bw
- tune: 28087,14043H = 920350135 = fcenter*2^32/140 = 30Mhz
- txSamples=17500
- s2_count=21000 .. start height window at 600 usecs or 90
km
- hghtSamples: 129500 .. covers 3.7 millisecs or 555 km.
- shift_fir = 8 . upshift value for fir output.
- sps:
- running 10 milliseond ipp, 440 usec clp pulse.
- Software:
- test run on pdevs0.
- scripts in ~thall/
- conf=pnet.conf.fir35M_20131108
- img=/pcmn/sasdr_image333
- pnet --conf=$conf --fpga=$img --extclk --dump=100000
- data was stored in .pdev format with 20 gb file sizes.
The data files recorded:
The following datafiles were taken:
- All files under /share/pdata0/pdev/
- You should access the files using /net/pdevs0/pdev/
- some files are 20gb. The /net mounts use the newer version
of nfs that works with large files
-
basename
|
size
gb
|
startTime
ast hh:mm:ss
|
nfiles
|
sasdr_world.20131108.b0a.00100.pdev
|
2
|
12:24;24
|
1
|
sasdr_world.20131108.b0a.00200.pdev
sasdr_world.20131108.b0a.00201.pdev
..
sasdr_world.20131108.b0a.00205.pdev
|
20
each file
|
12:25:52
|
6
|
The tx and rx windows:
Tx window before adding 2 samples/ipp
The first set of plots show the Tx
samples (.ps) (.pdf)
- Data was taken from the first 100 ipps (1 sec of data) of file
sasdr_world.20131108.b0a.00100.pdev.
- Top: overplot the I voltage samples for the first 10 ipps.
(the first 400 samples of each ipp are shown).
- The first 60 usecs blanked by the iflo blanking.
- The transitions are not occurring at the same spot
- Bottom: start of tx pulse for the first 100 ipps. over plot
with offset for display.
- You can see the 1st blanking region drifting to the right
for each ipp
- The start end of the drift are flagged : samples 38 and 237.
- the tx pulse is moving by 200samples/100 ipps or 2
samples/ipp
- The samples that come in on the left look like noise samples
(from the heights).
I corrected the 2 extra samples/ipp by reading 2 extra samples per
ipp. The plots below show this correction.
Tx window after adding 2 samples/ipp to
the reported values.
Start and end of the tx sample pulse
(after adding 2 samples/ipp). (.ps) (.pdf):
- Page 1: start of tx pulse
- frame 1,2: the i, q voltage samples for the start of the
txpulse
- bottom: blowup showing a single tx ipp.
- each + is a sample. I is blank Q is red
- The dashed green lines are spaced by 1 baud (2usecs or 70
samples).
- Page 2: end of tx pulse
- 100 ipps are overplotted
- Top is i, bottom is Q voltages
- Adding 2 samples to each ipp lines up the tx pulses.
The receive window:
The plots shows
the start of the receive window (.ps) (.pdf)
- Page 1: voltage samples start of receive window.
- Top i voltages
- Bottom: q voltages
- 25 ipps have been overplotted with an offset for display.
- the first 45 usecs of the receive window has no signal (from
the blanking).
- You can see each ipp moving to the left by about 4 samples.
- After 8 ipps the window jumps by about 32 samples back to
the starting value
- The dashed vertical lines is the farthest right the blanking
region attained,.
- Page 2: power
- Top: compute power for each sample then smooth.
- 300 meters of data were smoothed for each ipp, then
100 ipps were averaged.
- Bottom: average bandpass for receive window
- The spectral density was computed (using a 64K xform) for
the start of each rx window (skipping the blanked region).
- The spectra where then averaged for 1 second, converted
to db and then plotted.
- The shoulder at 422 Mhz is the 20 Mhz filter (at rf)
after the lna.
- The bump in the center is probably the spectrum of the
code from the ion line.
the dynamic spectrum shows the 1st
500 samples from the start of each ipp (.gif)
- You can see the end of the blanking moving and then coming
back every 8 ipps
- The dashed lines show the range of the drift (30 samples)
- My guess is that my lines are a little off. It is probably 4
samples/ipp or 32 samples in 8 ipps.
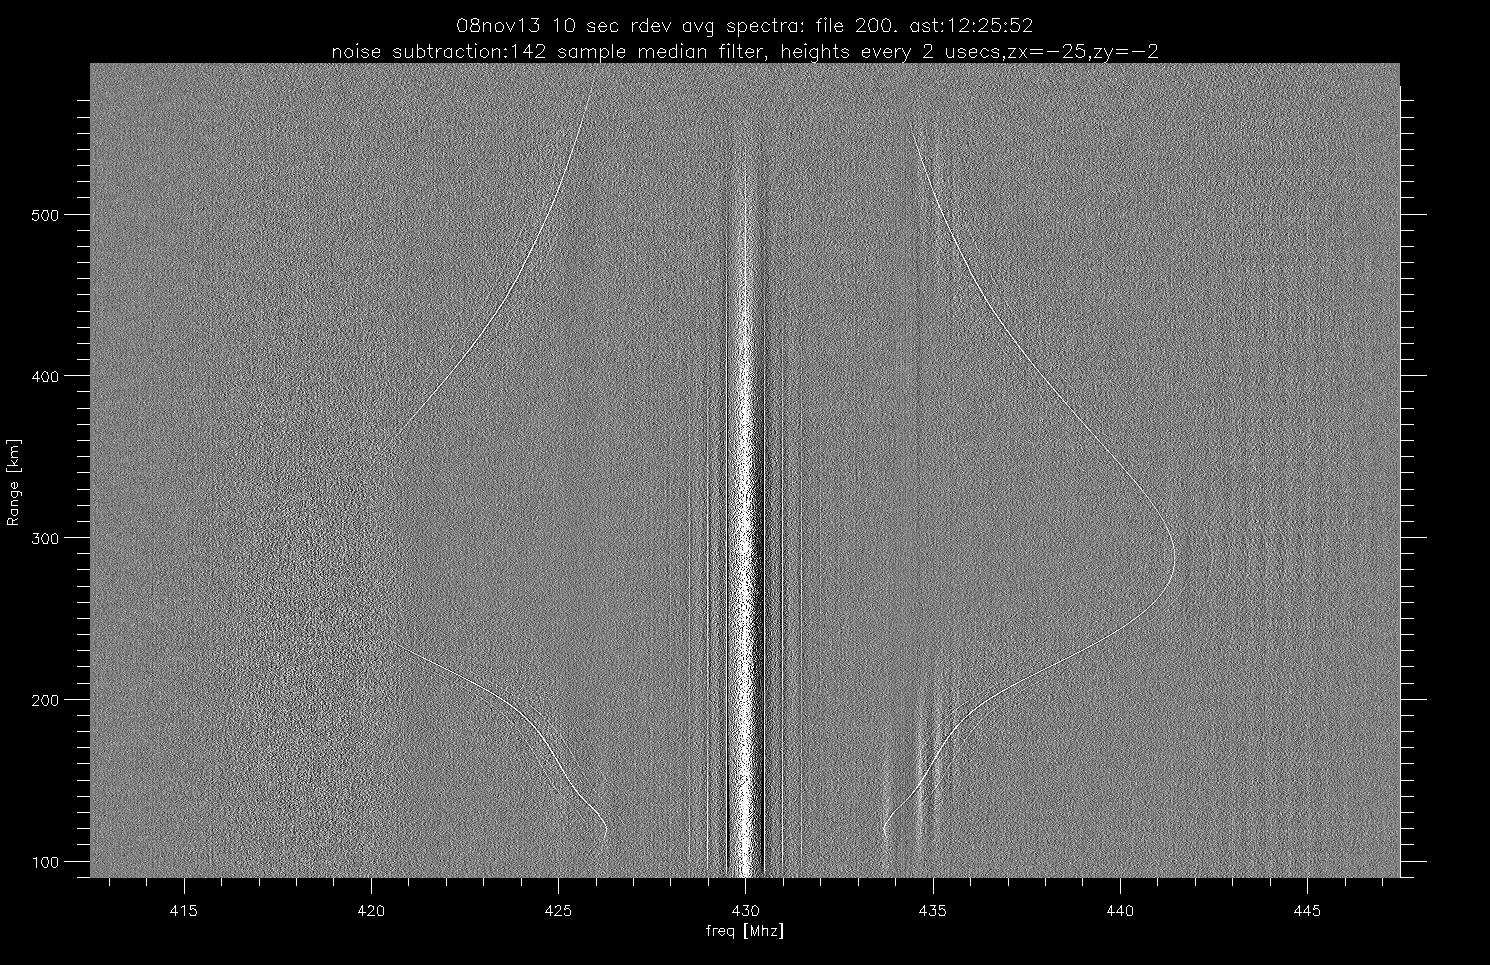
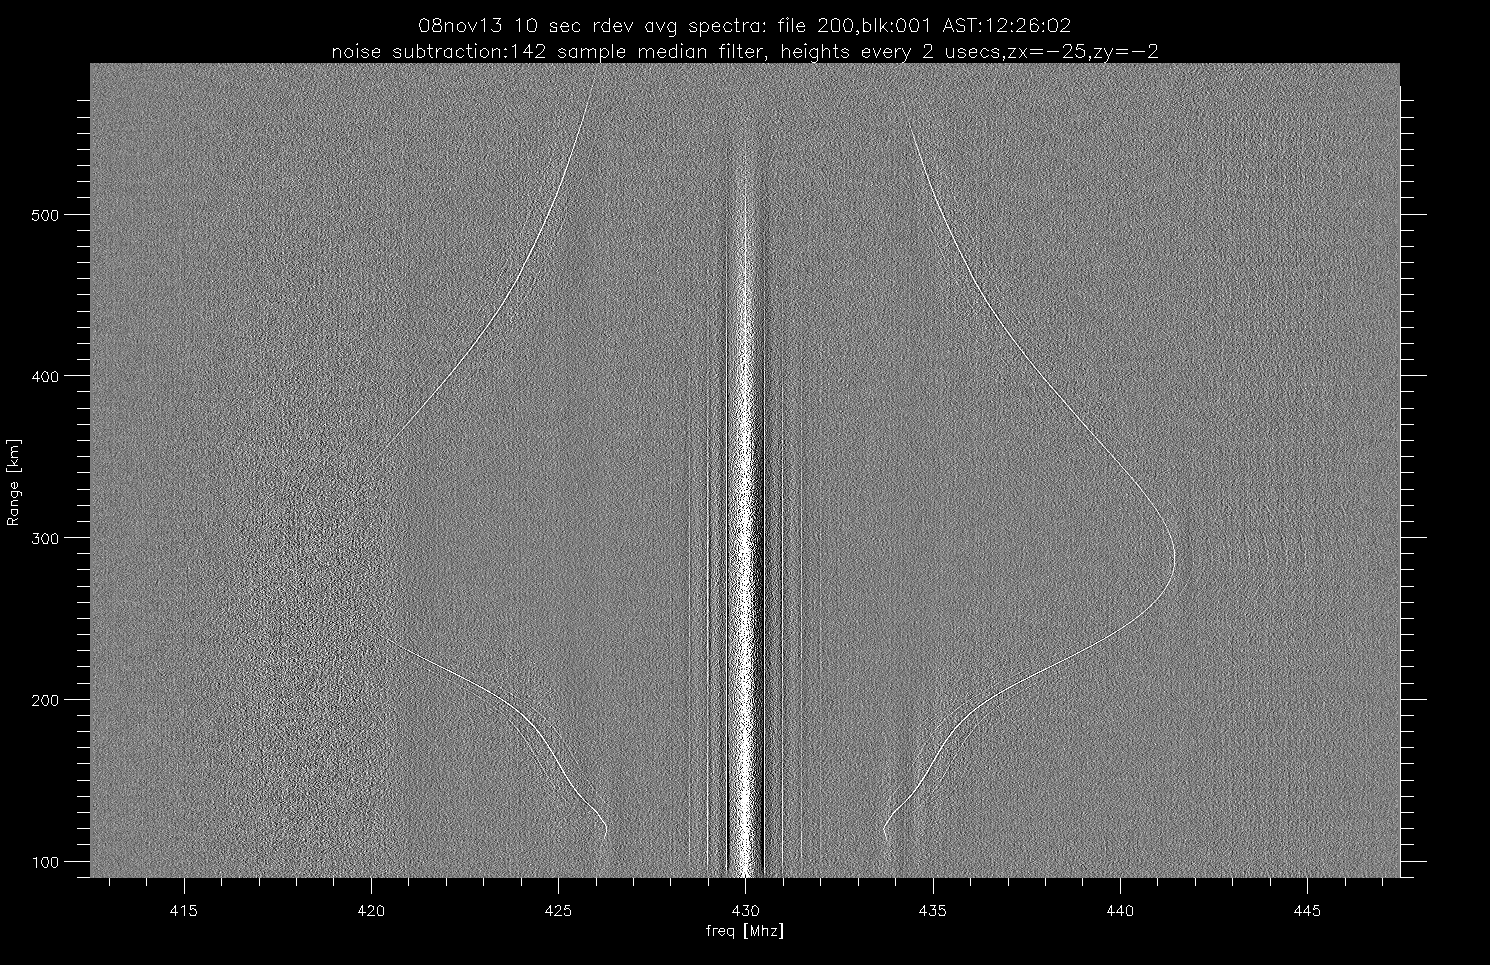
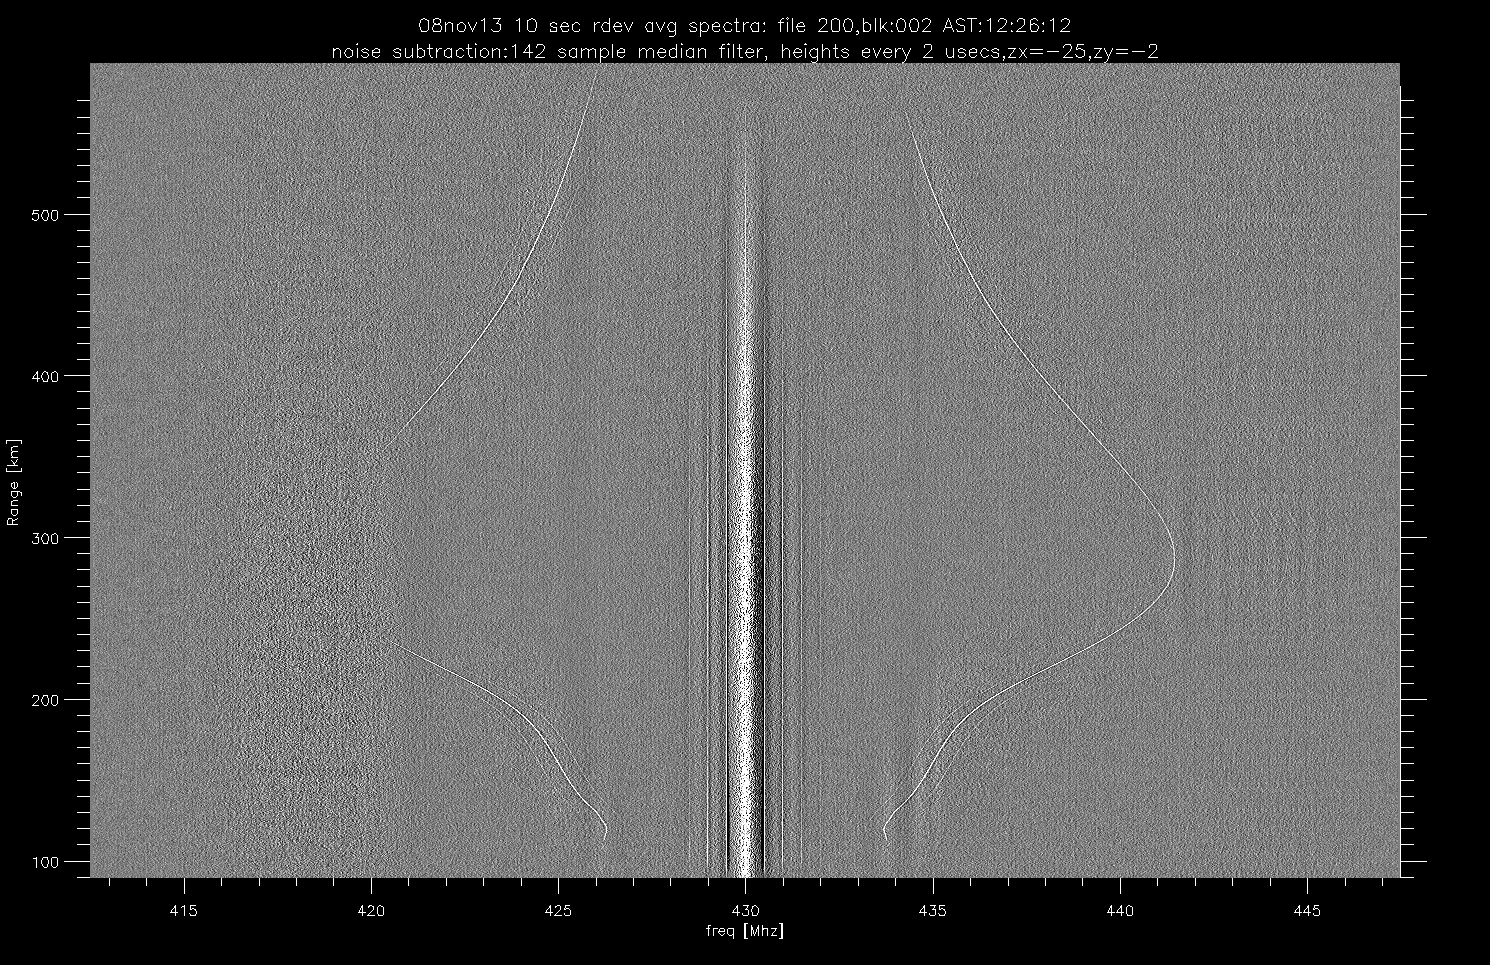
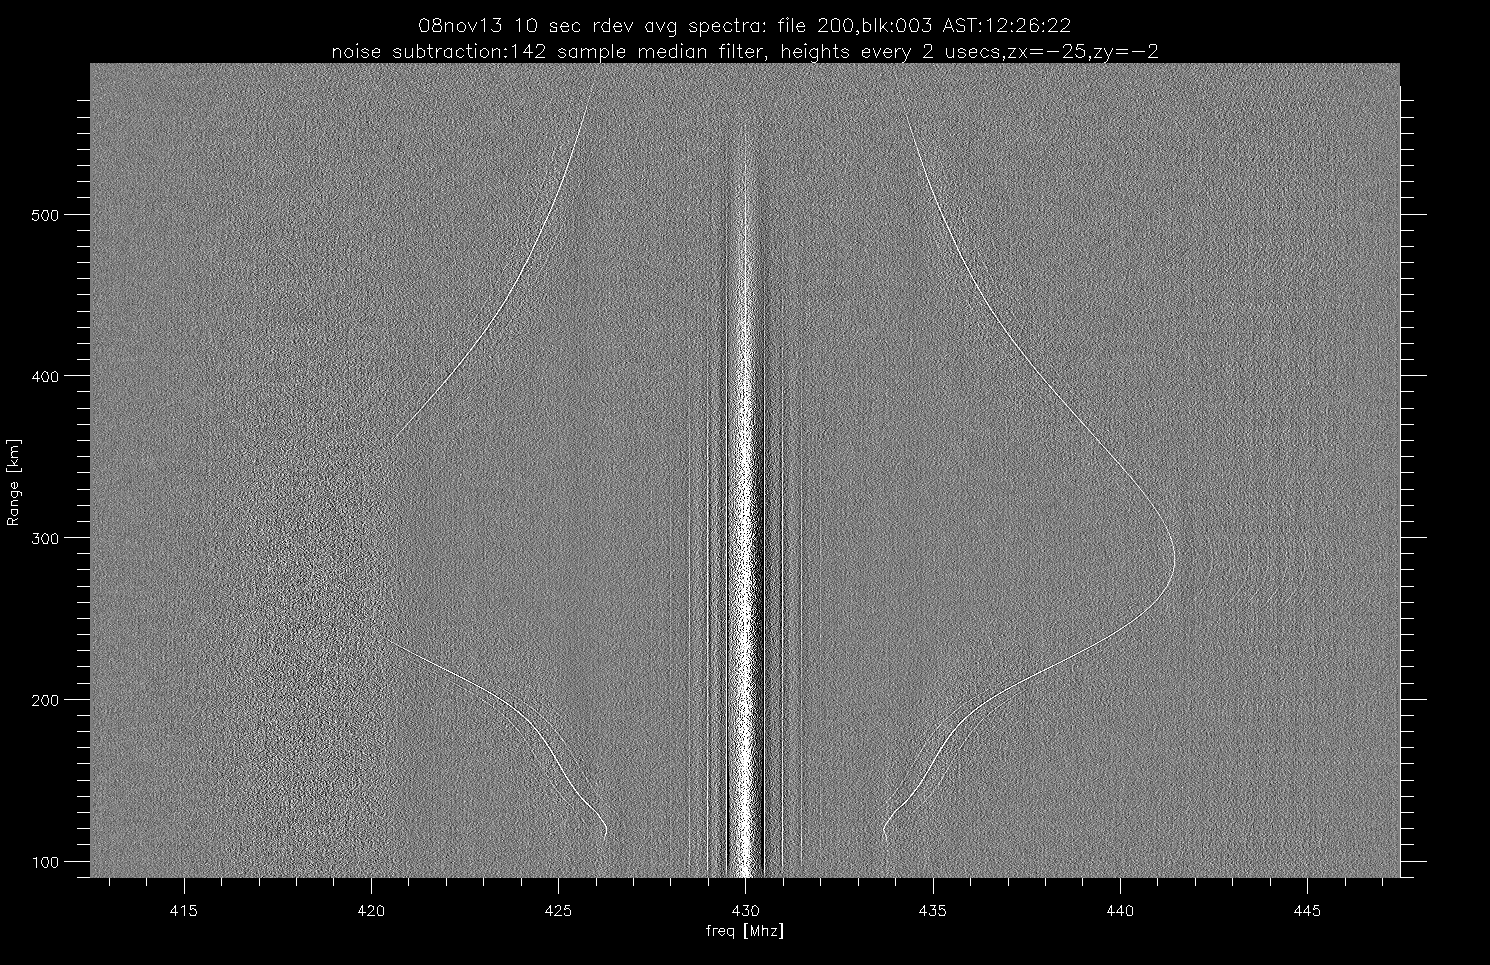
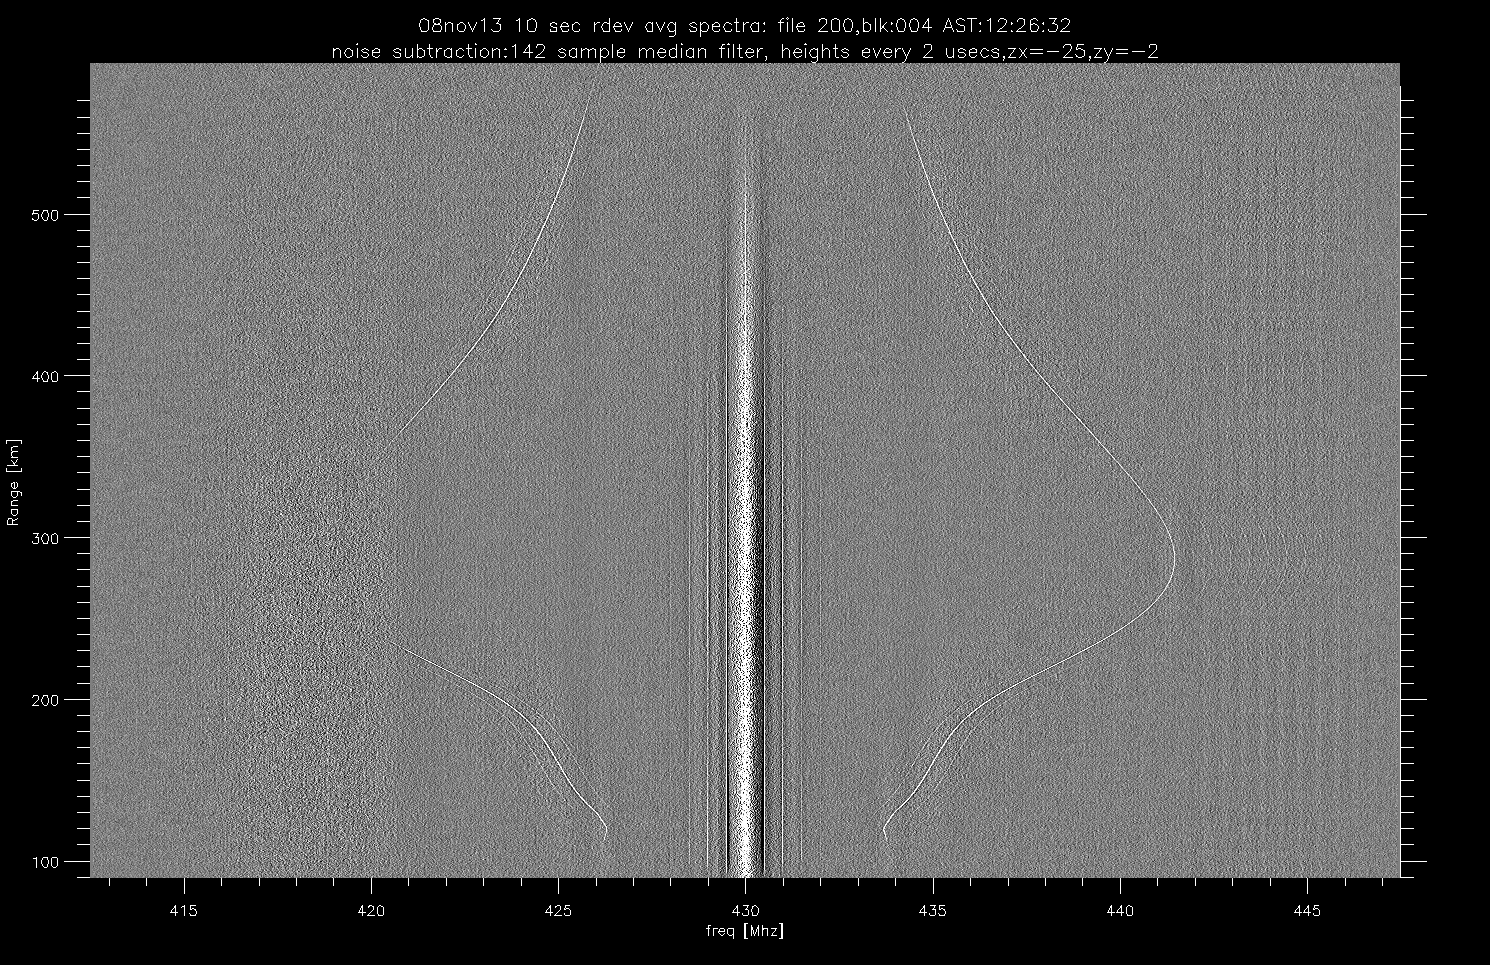
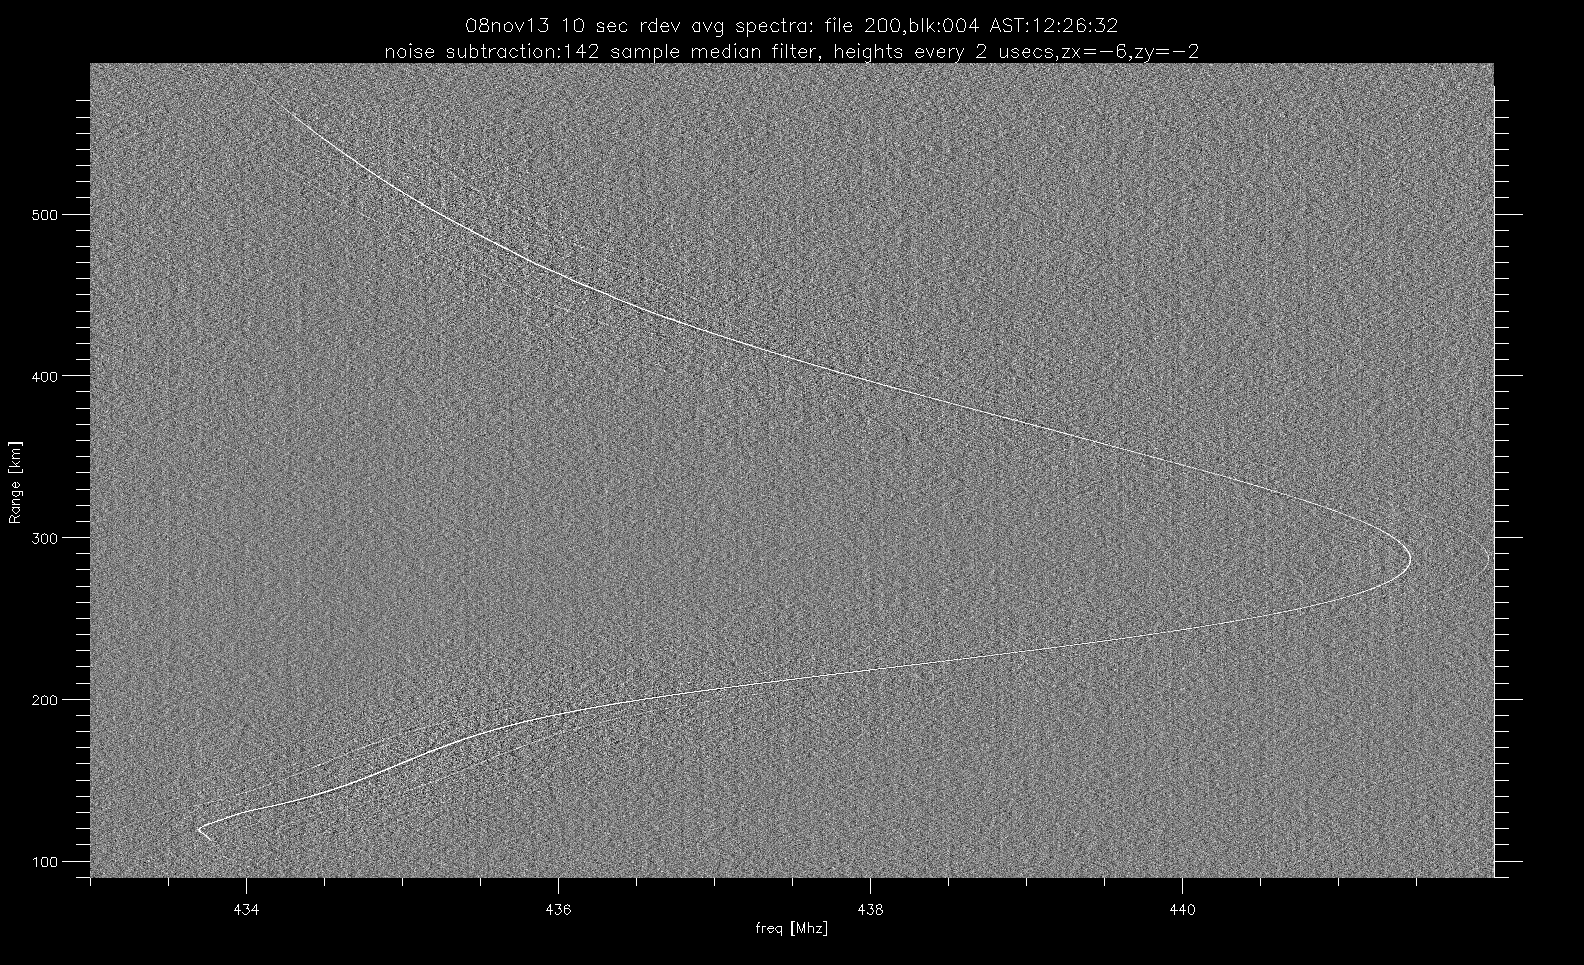
10 second decoded dynamic spectra:
Dynamic were made using 10 sec blocks of
decode data. The images came from file
sasdr_world.20131108.b0a.00200.pdev.
- 2 extra samples were read for each ipp to align the data
- The receive window shift was not corrected.
- 32k transforms were done to compute the spectra.
- spectra were kept every baud length (2 usecs).
- It took 15 minutes (in idl) to process 1 10 sec block.
- Each image has the freq axis smoothed by 25 bins, and heights
by 2 bins.
- The last image is a blowup where the freq is only smoothed
by 6 bins.
Summary:
- rdev is recording 2 extra samples for each ipp (using the tx
and rx window lengths as the reference).
- This was corrected in the offline software by increasing the
samples/ipp by 2.
- the receive window is moving by 4 samples/ipp to the left (it
is missing samples).
- After 8 ipps it jumps back to where it started.
- So the receive window is moving in time by 32
samples (or about 1 usecond) every 80 millisecs)
- This was not corrected in the offline software.
- Dynamic spectra show the upshifted and down shifted plasma
line.
- I probably need to spend some more time figuring out the
optimum median filter length to remove the noise.
- We only recorded 1630 heights. I spaced them by 2 useconds
(or1 baud). We probably want to double this.
- The i/o rate from spectrometer to file server (about 65
Mbytes/sec) is limiting the number of heights.
- We can trade off bandwidth channels for more heights.
- Changing the clock frequency will let us tune this (as long
as the fpga doesn't mind)
processing:
x101/rdev/131108/clptest.pro , procdata.pro
The decoded data is stored on
x101/rdev/131108/data/ (megs3 disc)
<-
page up
home_~phil