Links:
intro
setup
datataking
Spectra at field
fox for all 3 filter configurations.
Azimuth dependence of rfi
using spectra at horn output
Total power vs azimuth
to check for lna compression.
Summary
INTRO
The QRFH was mounted on the 12meter and tests
were done to measure the power levels using different hi pass
filters. We wanted to see if a hi pass filter was needed before
the lna in the cooled system. The tests were done 16 ->
21jun22.
SETUP
- QRFH horn mounted at the focus of the 12 meter.
- The mouth of the horn was 21.6 inches from the
center of the secondary for these measurements.
- 44 db gain amp mounted at output of QRFH horn
- 9916 field fox spectrum analyzer was used to measure the
levels.
- We initially tried using the sband cables to bring
the signal down from the horn to the pedestal.
- The loss in the cables was limiting the dynamic range we
could achieve.
- The field fox was then mounted up close to the horn.
- An ethernet cable was strung from the field fox to the
pedestal so we could remotely control the field fox.
- The signal path was:
- QRFH -> 3" cable -> 44db amp->biasT-> 4 foot
cable ->biasT->HiPass filter -> field fox
- the biasT's were used to power the amp.
Data taking
Data was taken on 4 days
- 16jun22: 2.8 GHz hi pass filter
- step in azimuth and then step in elevation
- az: -90deg to 270 deg in 45 Deg steps after 1 rotation,
step in elevation
- el: 8, 33, 58, 83 degrees
- FieldFox setup
- 2-12 GHz span, 1Mhz rbw,vbw=rbw, 10001 points, pwr
detector, pwr avg sweeps
- preamp on, attn=5db
- avg 3 sweeps, output, then repeat 20 times. at each
position.
- 18jun22: 2.8 GHz hi pass filter
- step in azimuth and then step in elevation
- az: -90 to +270 in 24 deg az steps then step in
elevation
- el: 8,28,48,68 degrees
- Field fox setup:
- 2-12 GHz span, 1Mhz rbw,vbw=rbw, 10001 points, pwr
detector, pwr avg sweeps
- preamp on, attn=5db
- avg 3 sweeps, output, then repeat 10 times. at each
position.
- i doubled the number of az positions from
16jun22, so halved to number of output records.
- 20jun22: 2.5 GHz hi pass filter
- drive continuously in azimuth, step in elevation
- az -90 to 270 at .2 deg/second
- a field fox sweep took about 6 seconds , so the
telescope moved 1.2 degrees during a single sweep.
- the telescope beam varies from 40amin to about 10amin
.
- the telescope moved 2 to 7 beams during a sweep.
- el: step 6 deg -> 81 deg in 5 degree
increments.
- Field fox setup:
- 2-12 GHz span, 1Mhz rbw,vbw=rbw, 1001 points, pwr
detector
- preamp off, attn=0db
- No sweep averaging. output to disc each sweep (which
took about 6 seconds)
- it took 30 min/rotation. 8 hours in total.
- 21jun22: no hipass filter:
- (same as 20jun22)
- drive continuously in azimuth, step in elevation
- az -90 to 270 at .2 deg/second
- a field fox output took about 6 seconds , so the
telescope moved 1.2 degrees during a sweep
- the telescope beam varies from 40amin to about 10amin
.
- the telescope moved 2 to 7 beams during a sweep.
- el: step 6 deg -> 81 deg in 5 degree
increments.
- Field fox setup:
- 2-12 GHz span, 1Mhz rbw,vbw=rbw, 1001 points, pwr
detector
- preamp off, attn=0db
- No sweep averaging. output to disc each sweep (which
took about 6 seconds)
- 30 minutes per rotation
- Notes:
- 16,18 jun22 has 10001 points of 1 MHz rbw covering 10
GHz.
- to compute total power, just add up all of the spectra
channels
- 20,21 jun22 had 1001 points of 1MHz rbw covering 10 GHz.
- power detect mode was used
- there were 10 sampled points for every output point.
- The detector would average the power of these 10
points before outputting
- To get total power,add up all the spectral channels
then multiply by 10.
- I verified this when measuring the field fox noise
floor with a 50ohm load with both setups.
Plotting the FieldFox spectra during
the az,el motion
The spectral density vs azimuth,el motion is
plotted for each day.
- For the azimuth steps
- 20 3 sweep averages are output for each position.
- The plots input the 20 records and display the average
of the 20 recs
- For the azimuth swings:
- a single spectra is output every 1.2 degrees. No
averaging is done.
- For the plots i interpolated each freq channel to 1 deg
azimuth spacing.
- The plots show the spectral density at the input the to
field fox (after the 40db of gain)
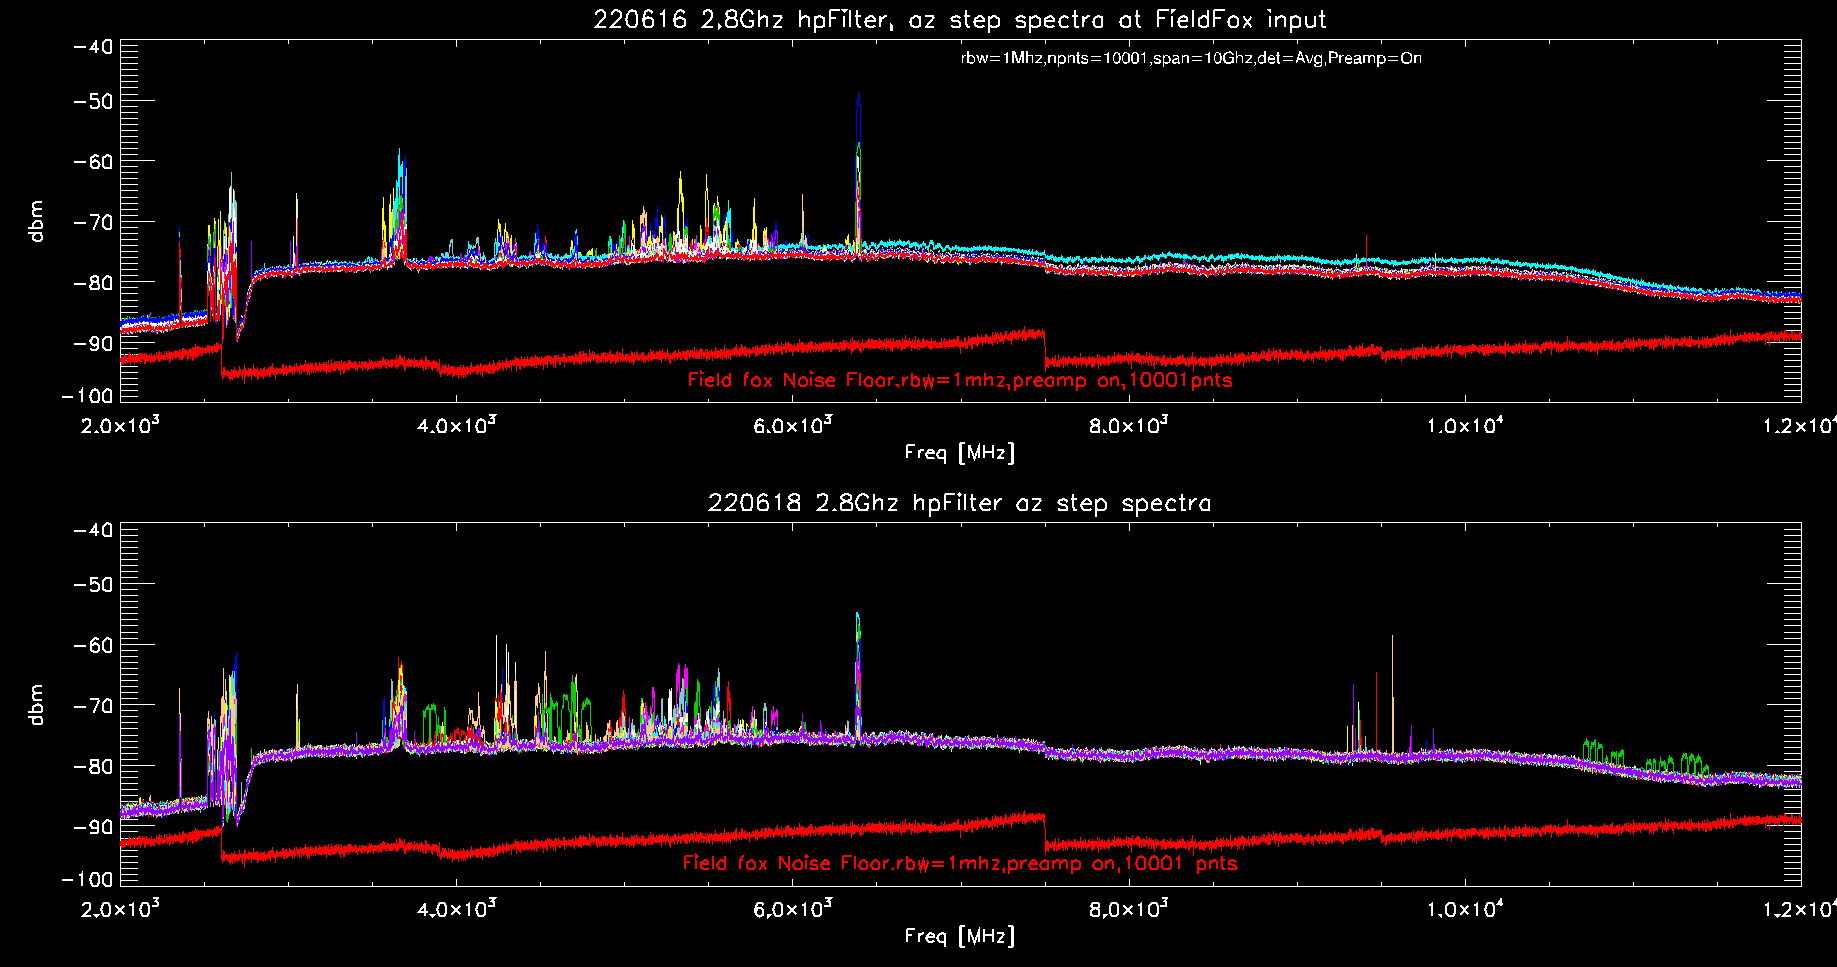
2.8 GHz hipass
filter spectra (.png)
- 10001 pnts of 1MHz rbw across the 10GHz
- Each color is a different location
- The red spectrum at the bottom of the plot is the field
fox noise floor with a 50 ohm load.
- The strongest spike is around 6.4 GHz (probably a point to
point microwave link)
- The 44db amplifier gain falls off above 10GHz.
- Top Frame: 16jun22
- azimuth -90 to 270 in 45 degree steps.
- el 8, 33, 58, 83 degrees
- average the 20 3swp average spectra at each position.
- bottom frame: 18jun22
- az -90 to 270 in 24 degree steps.
- el: 8,28,48,68 degrees
- azimuth -90 to 270 in 45 degree steps. step in el 8, 33,
58, 83 degrees
- average the 10 3swp average spectra at each position.
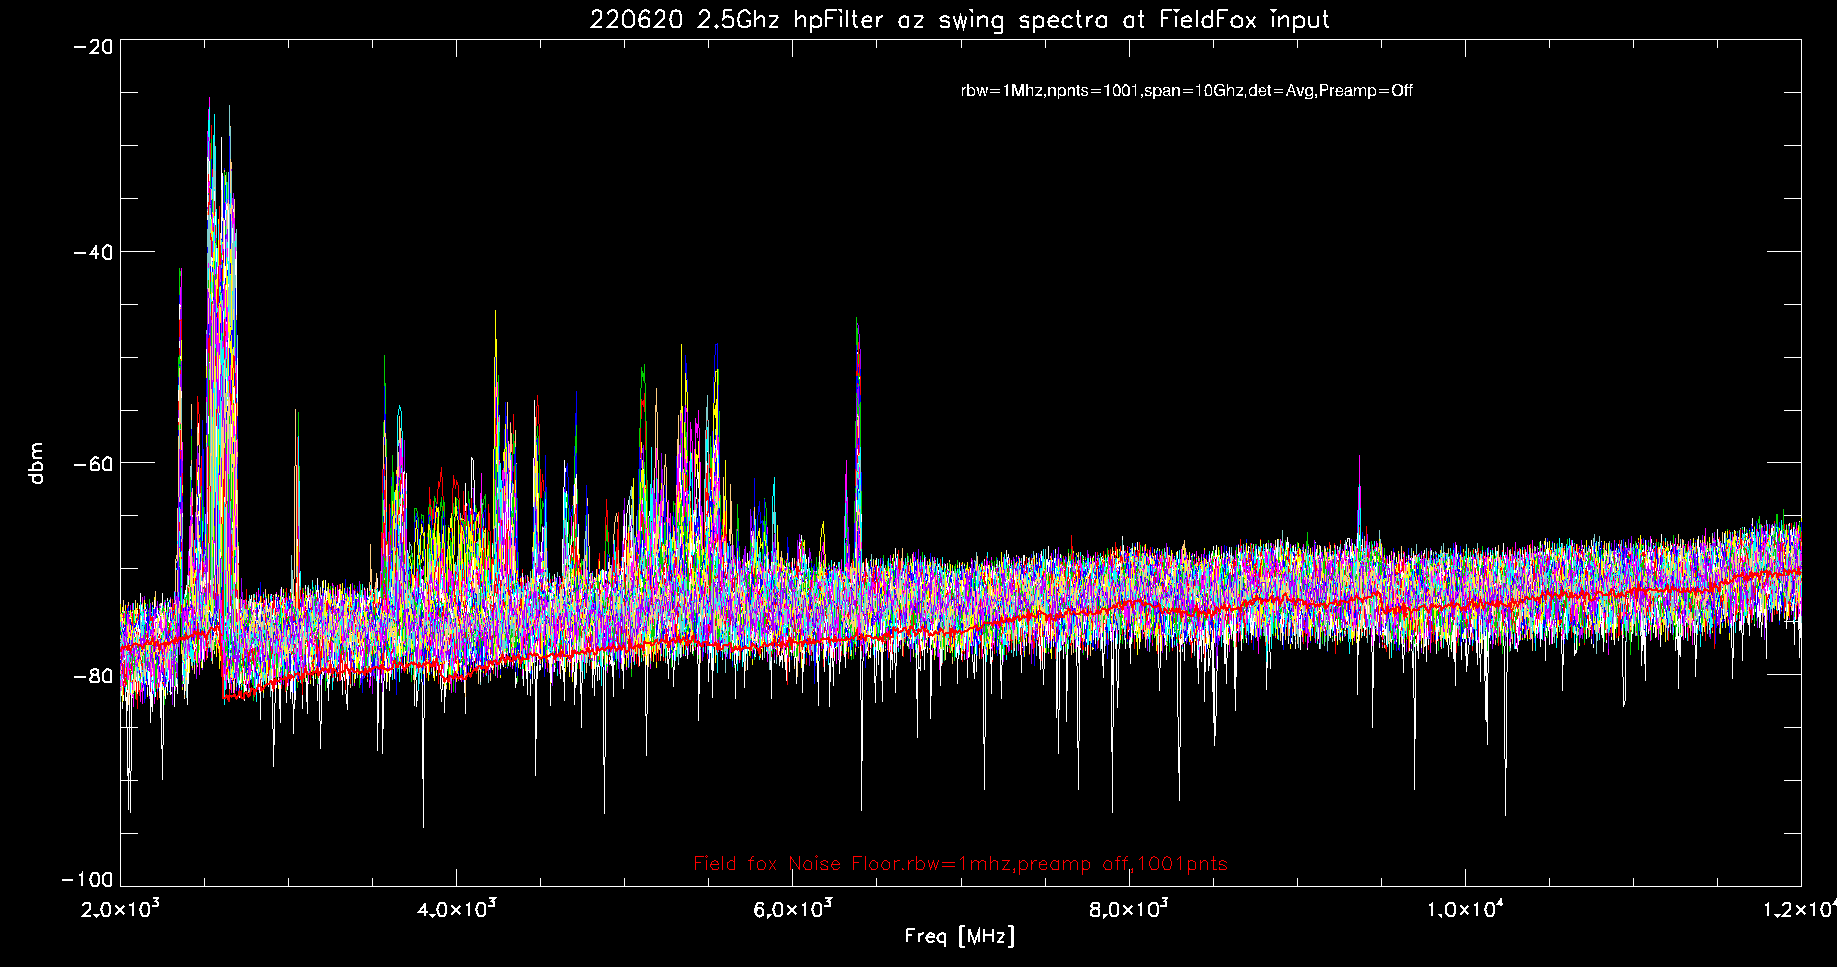
2.5 GHz hipass
filter spectra (.png)
- 1001 pnts of 1MHz rbw across the 10GHz
- The field fox averaged 10 samples for every output
point.
- i did not increase the spectral density by 10db.
- az swing -90 to 270 at .2 deg/sec, el 6 -> 81 deg in 5
deg steps.
- Some of the 2350 MHz birdies are getting through the
filter.
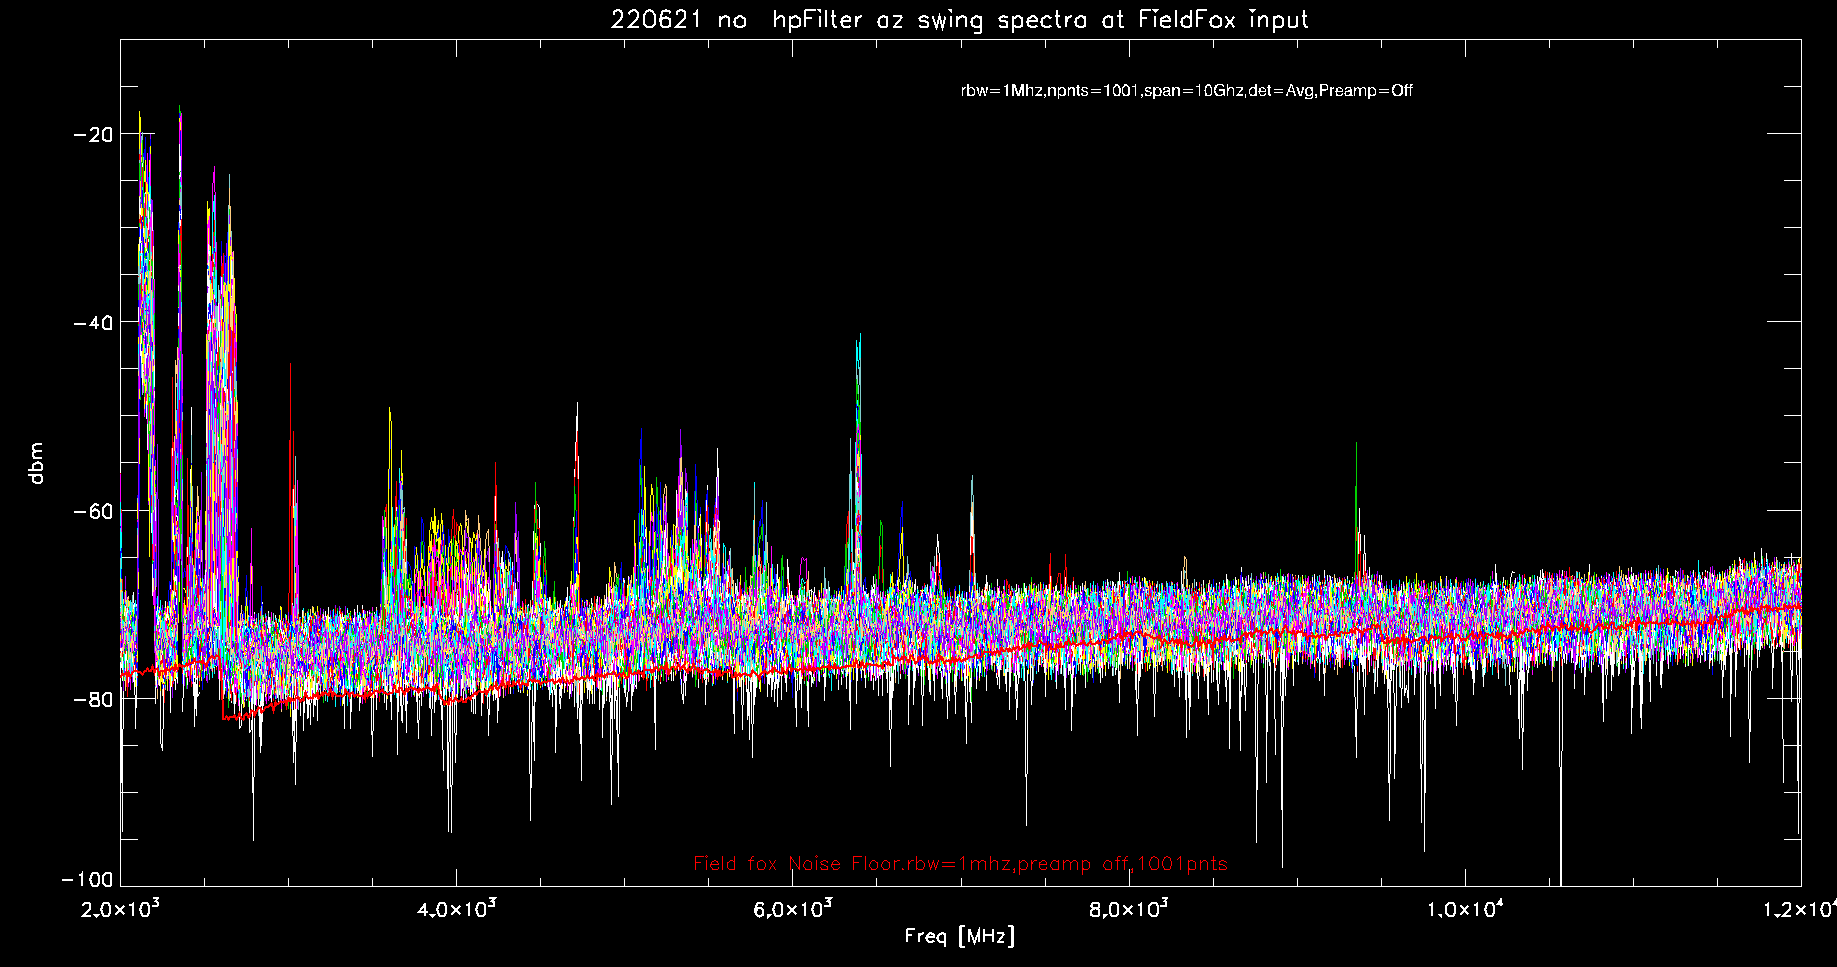
no hipass filter
spectra (.png)
- 1001 pnts of 1MHz rbw across the 10GHz
- The field fox averaged 10 samples for every output
point.
- i did not increase the spectral density by 10db.
- az swing -90 to 270 at .2 deg/sec, el 6 -> 81 deg in 5
deg steps.
Rfi from az swings with no hiPass filter
(at horn output)
The az swing spectra taken with no hi pass
filter on 21jun22 were used to check the power levels and rfi
vs az and el.
Each field fox spectra had the gain of the system removed so
the spectral density was at the output of the QRFH.
The azimuth swings went from 6 to 81 deg elevation in 5
deg steps.
The field fox was set to:
- 2 to 12 GHz (10 GHz span)
- 1 Mhz rbw, detector mode=pwr avg
- 1001 points
- there are 10 rbw's averaged for each displayed
point.
- The spectra and total power from the field fox were
multiplied by 10 to correct for this.
The first set over plots the spectra from each azimuth
swings and then blowups in freq (.ps) (.pdf)
- Each color is an azimuth swing at a different elevation.
- The red line at the bottom is the field fox noise floor
referenced to the horn output level.
- Page 1 covers the entire frequency band. Pages 2-6 are
blowups in freq around areas that show rfi.
- Page 1: 2000-1200 MHz spectra:
- top: peak hold spectra for each azimuth swing
- middle: average spectra for each azimuth swing
- bottom: min hold spectra for each azimuth swing.
- Page 2: 2000 - 3000 MHz . rfi at:
- 2100 -2200 aws1,aws2,aws3 (Advanced Wireless serivices)
- 2320-2345 siriusxm radio satellite.
- 2340-2355 aws2 (at&t)
- 2400-2500 ism band
- 2500-2700 brs-ebs
BroadbandRadioServices-EducationalBroadbandService
- Page 3: 3000-4000 MHz
- 3000-3050 (pico del este radar?)
- 3550-3700 citizens broadband services
- Page 4: 4000-5000 MHz
- Page 5: 5000-6000 MHz
- 5150-5850 U-NII band (internet providers)
- Page 6: 6000-7000 MHz
- 6370-6400 Probably a microwave link
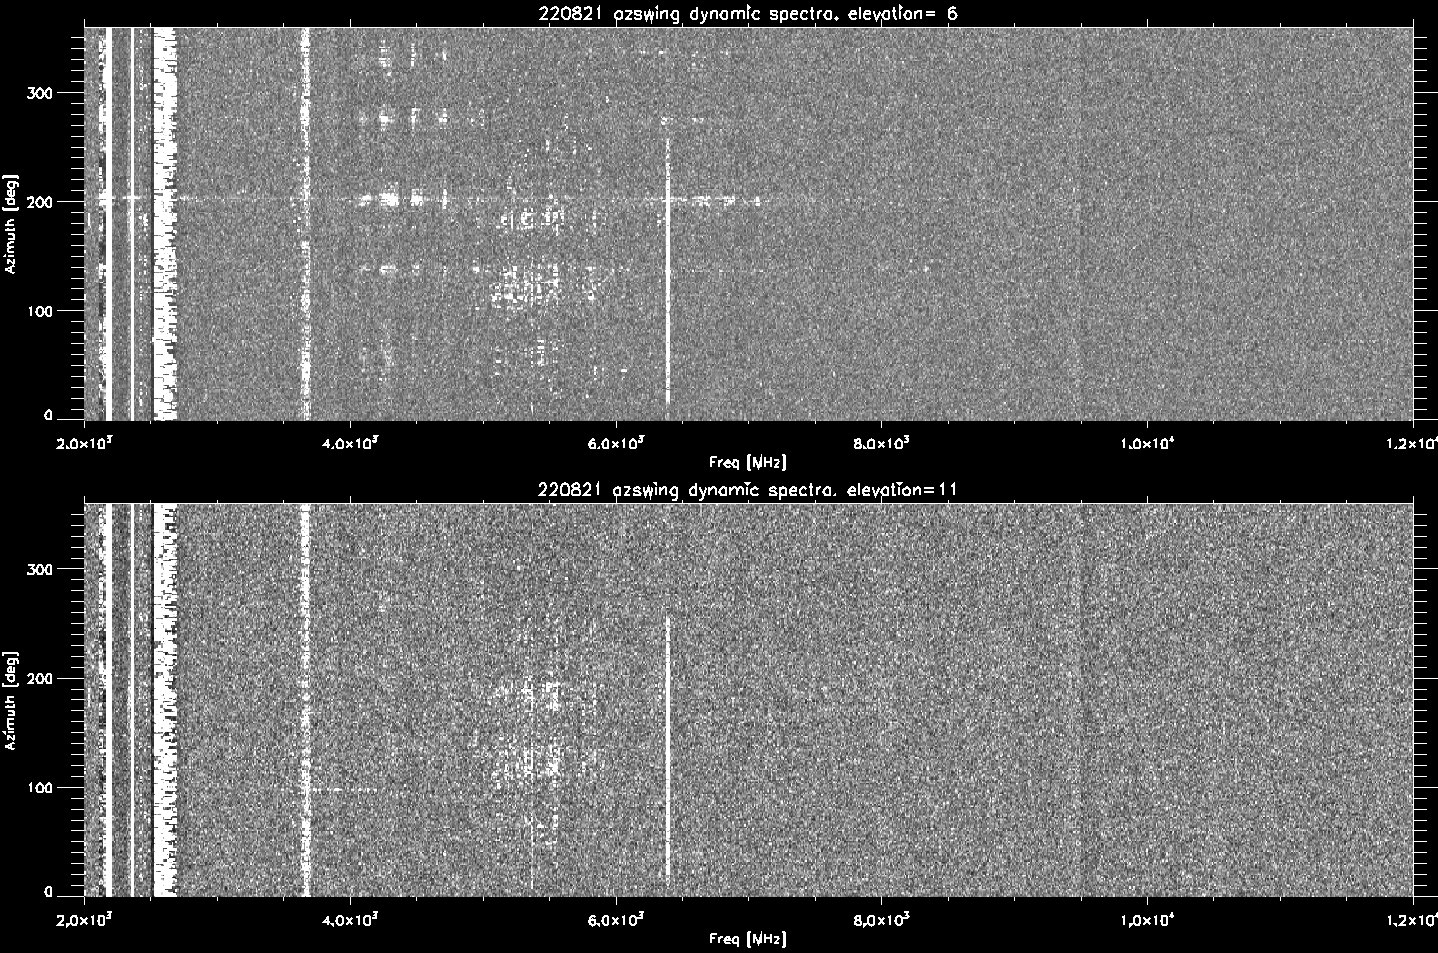
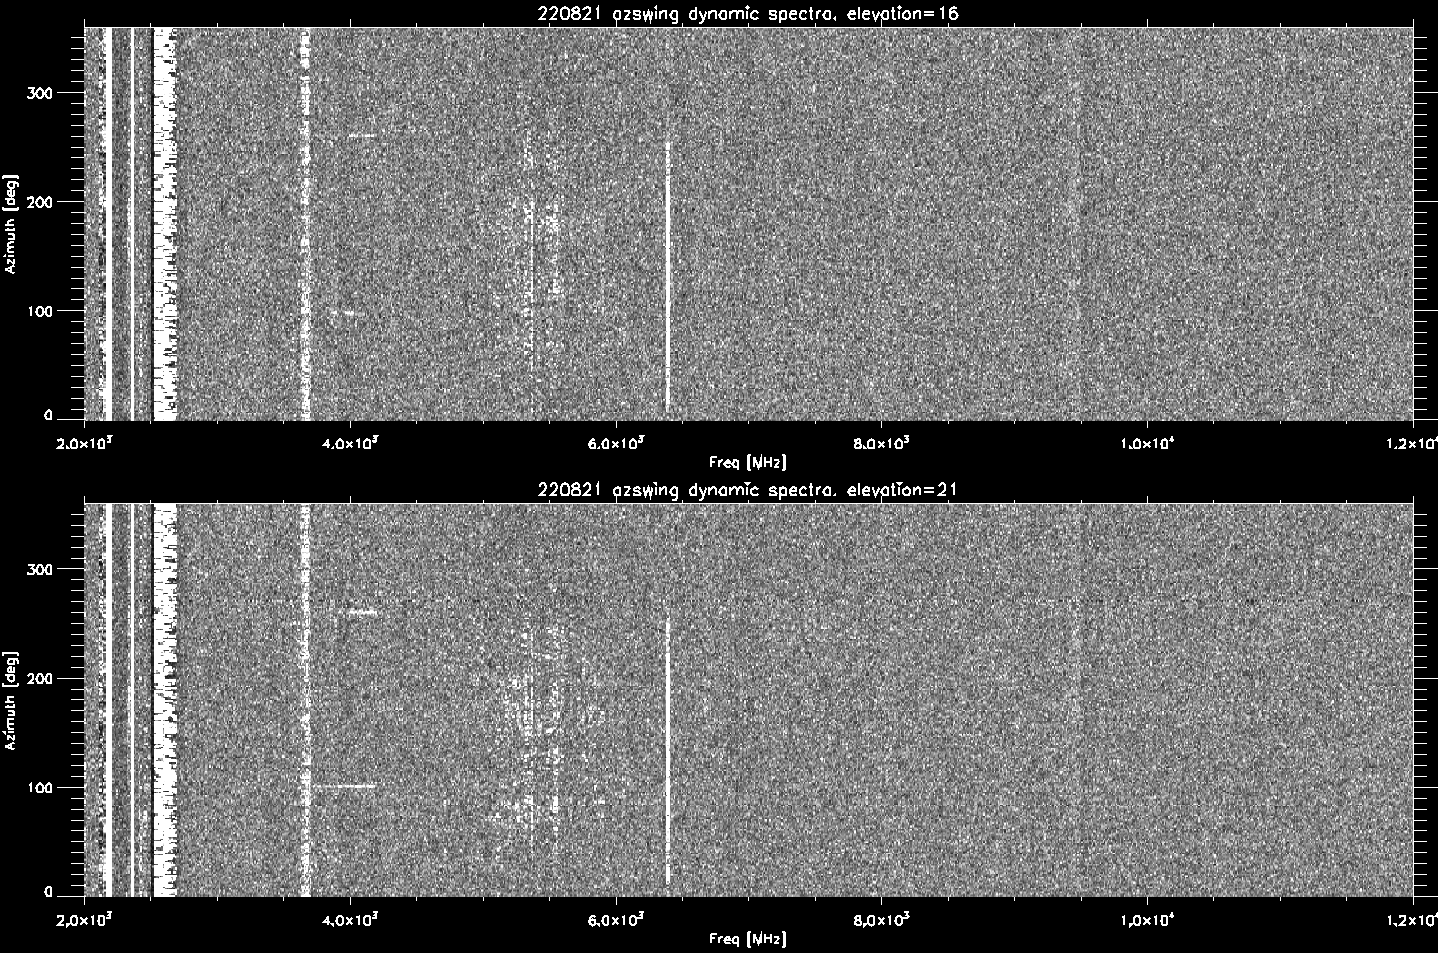
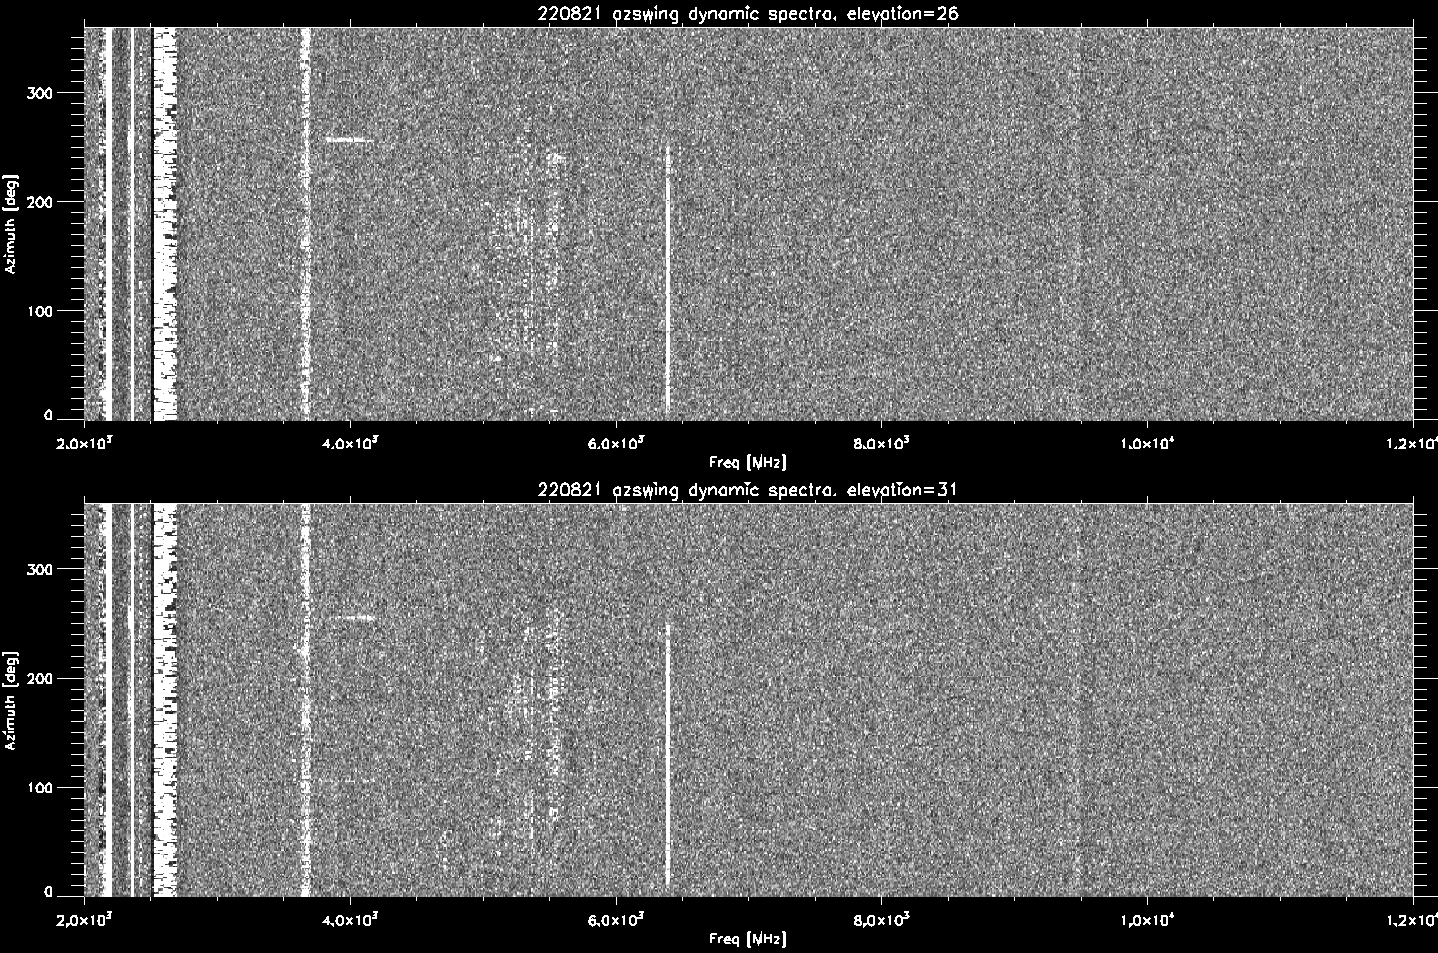
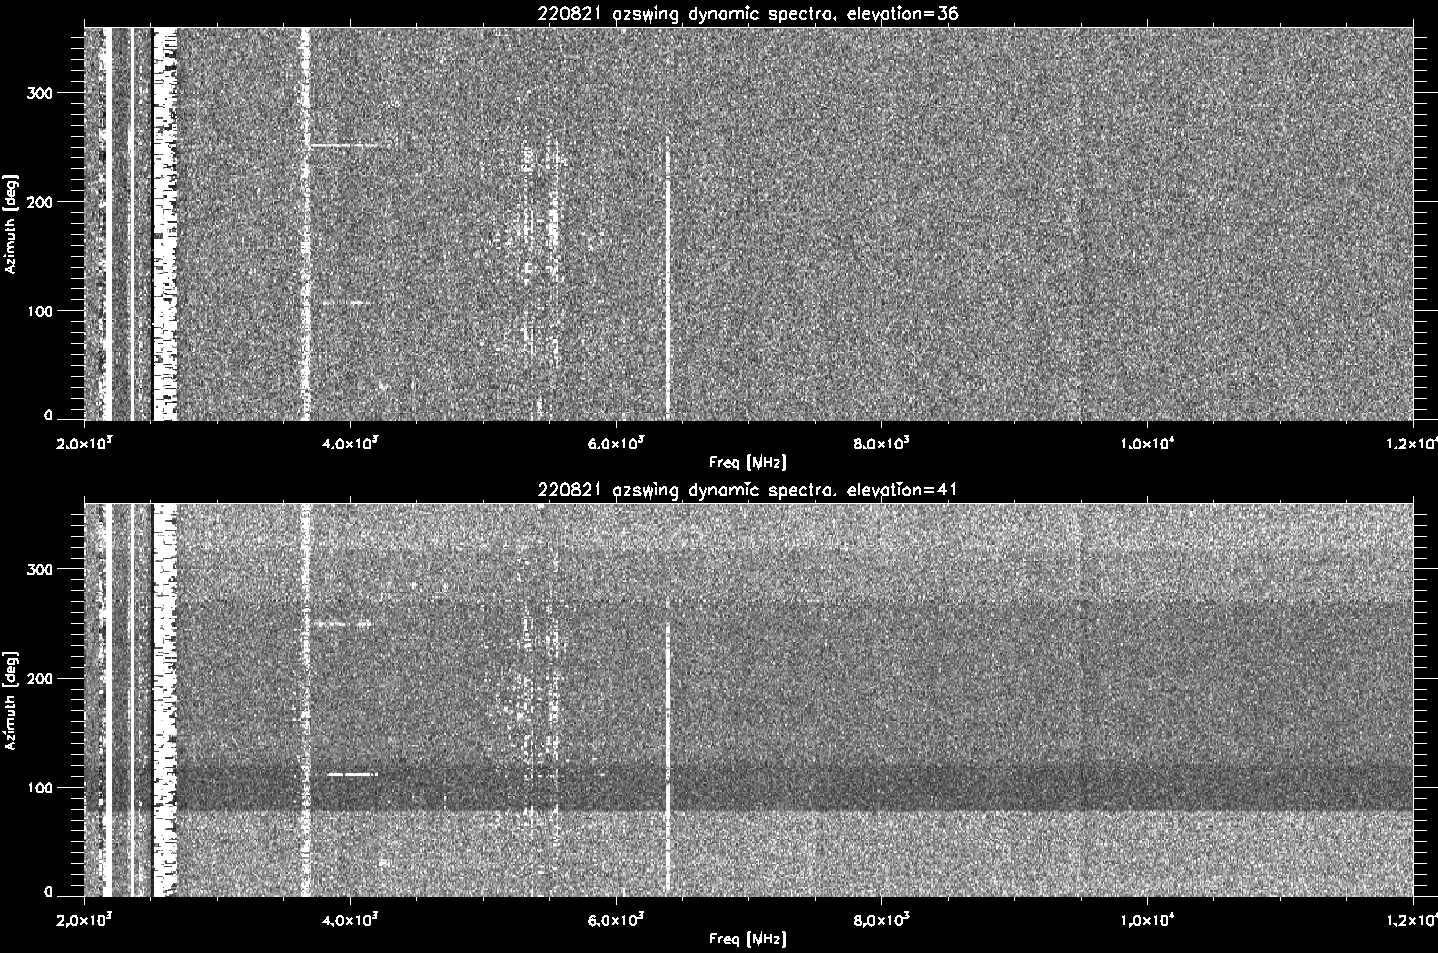
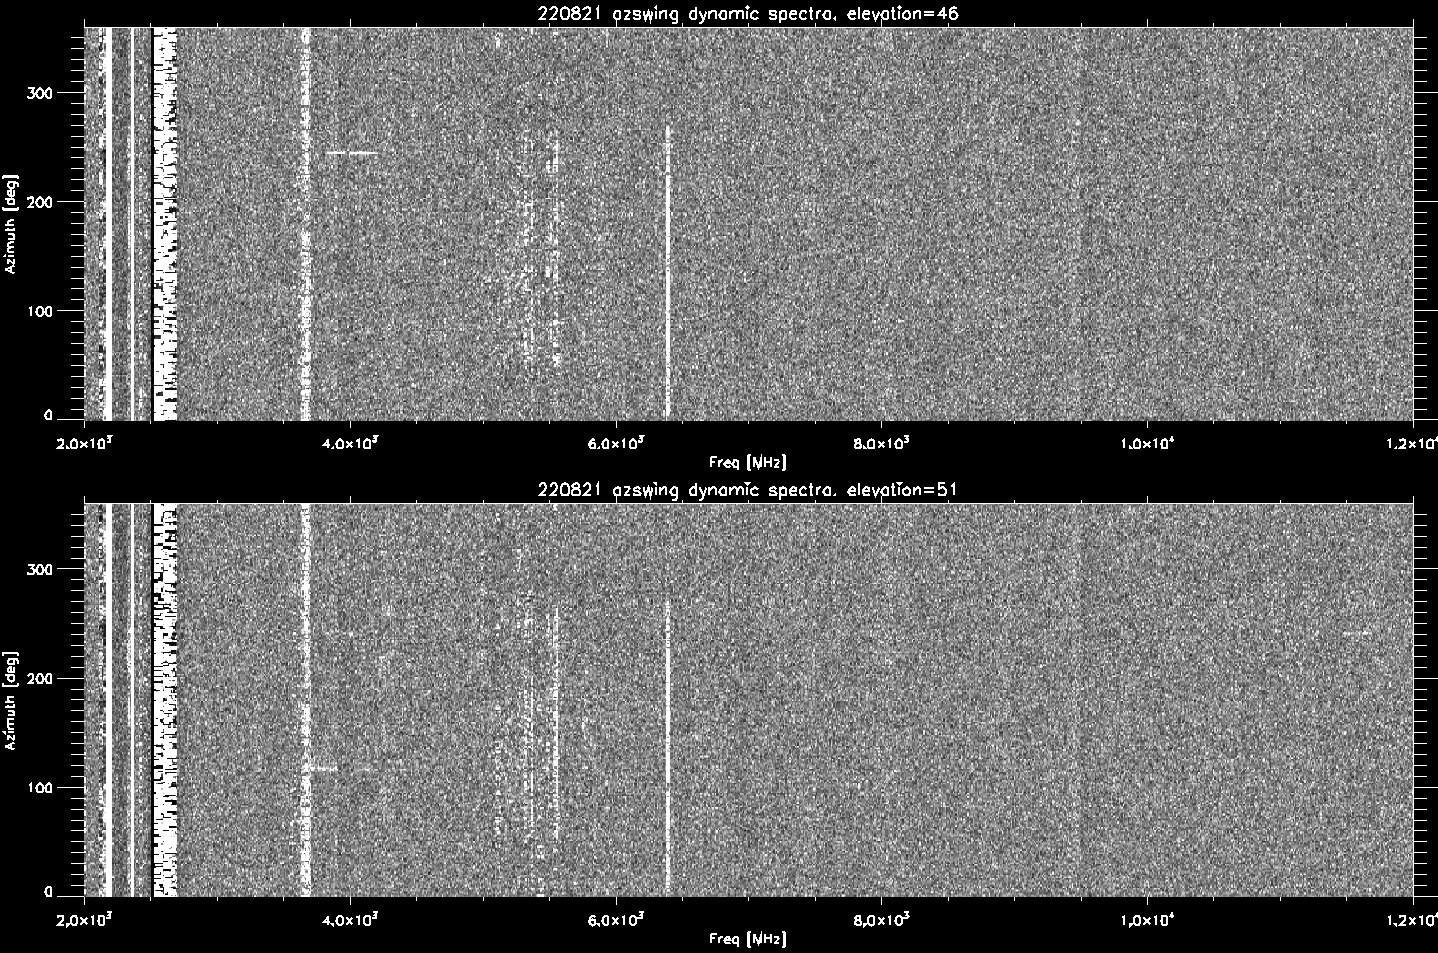
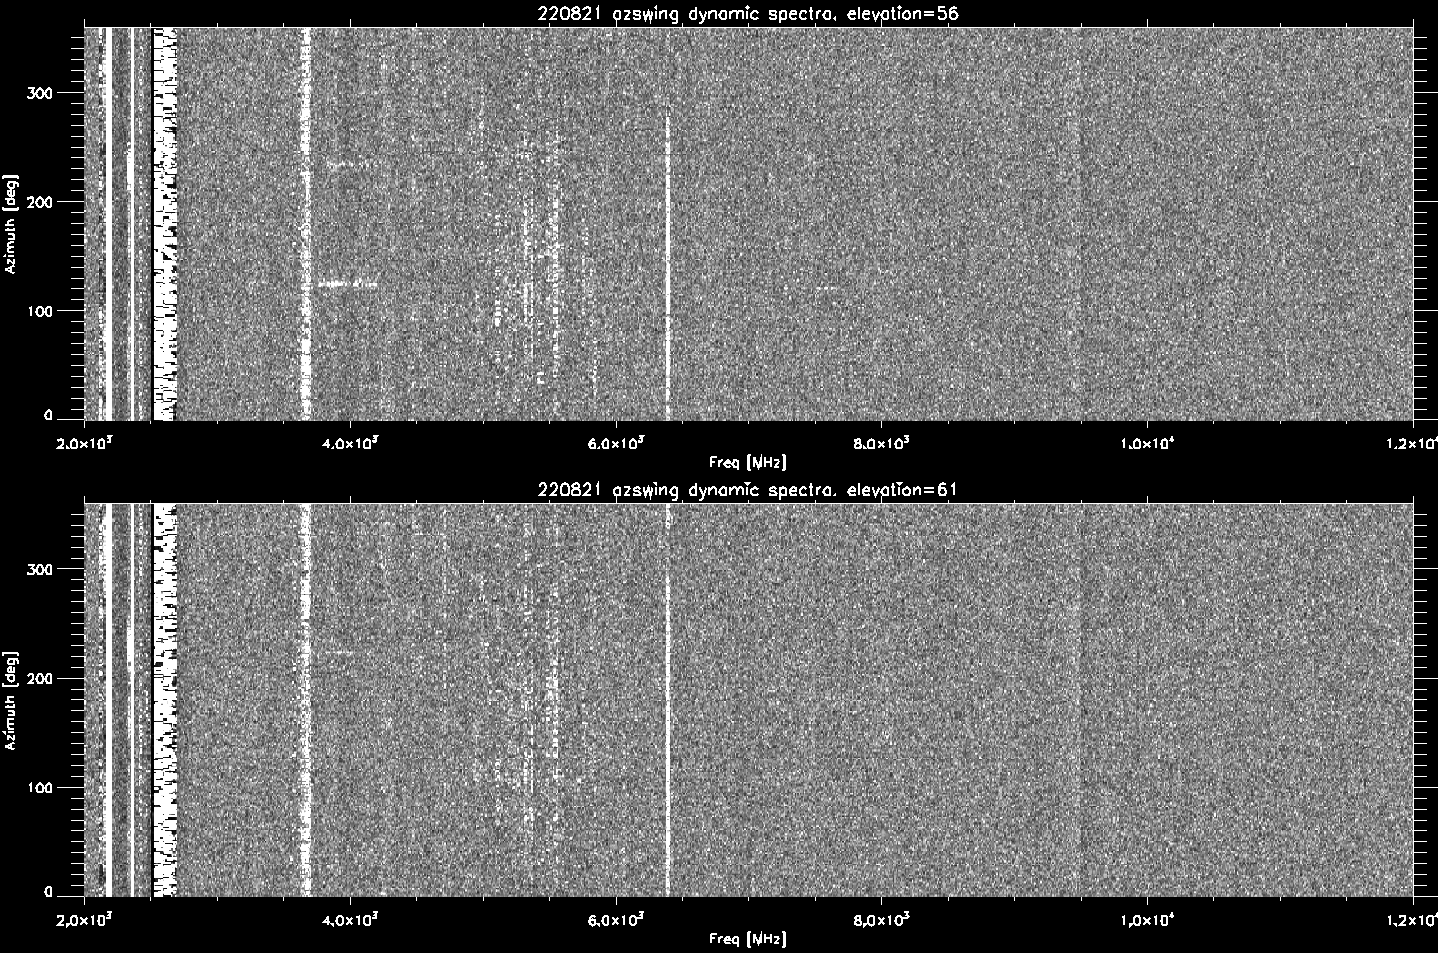
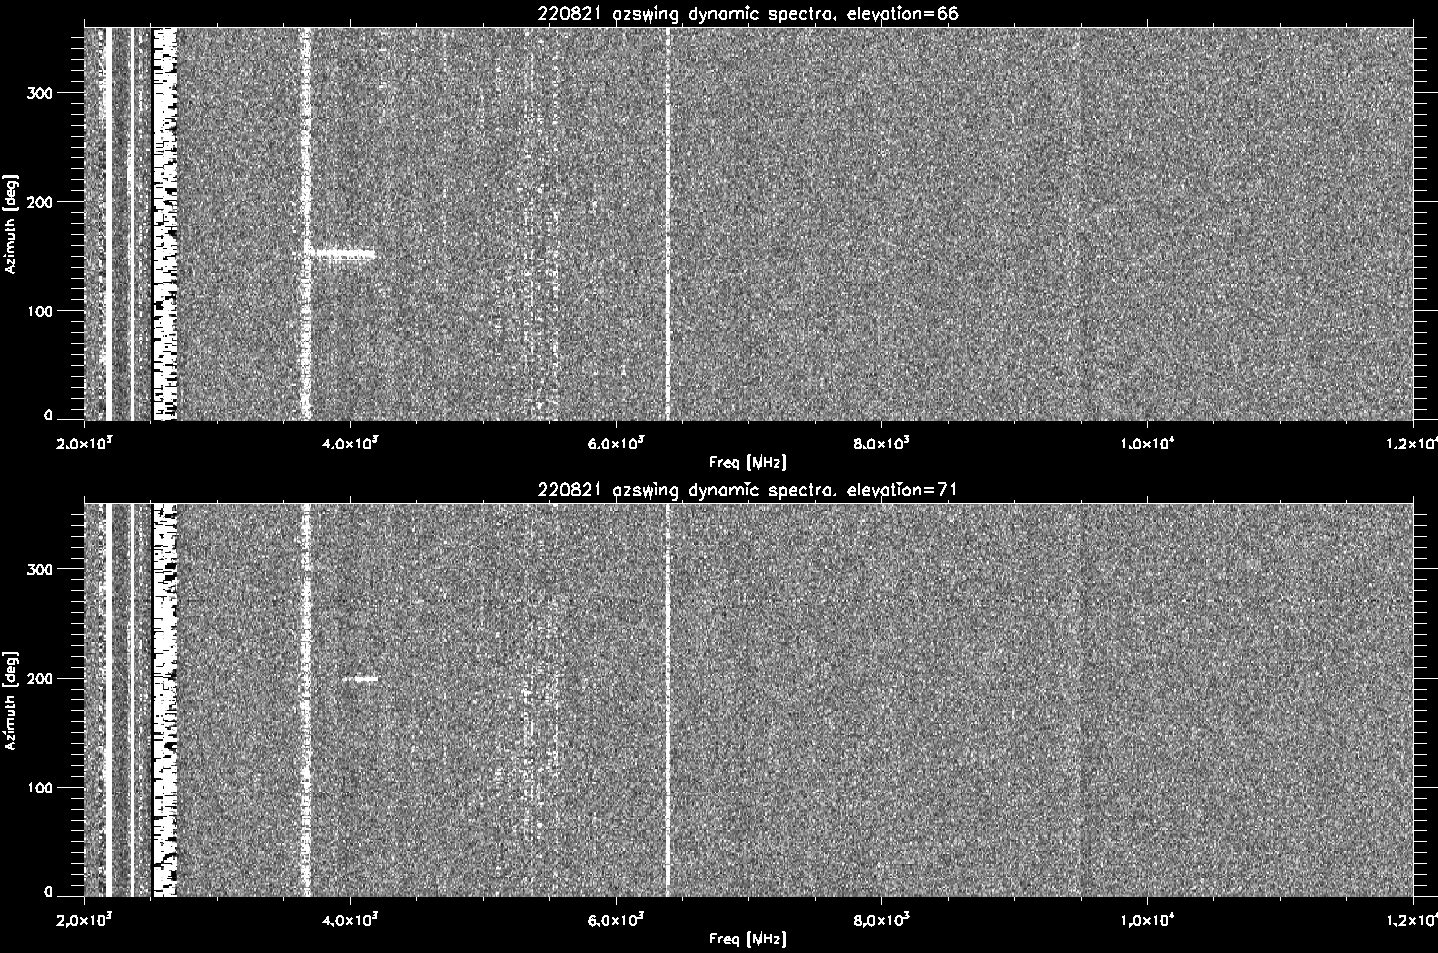
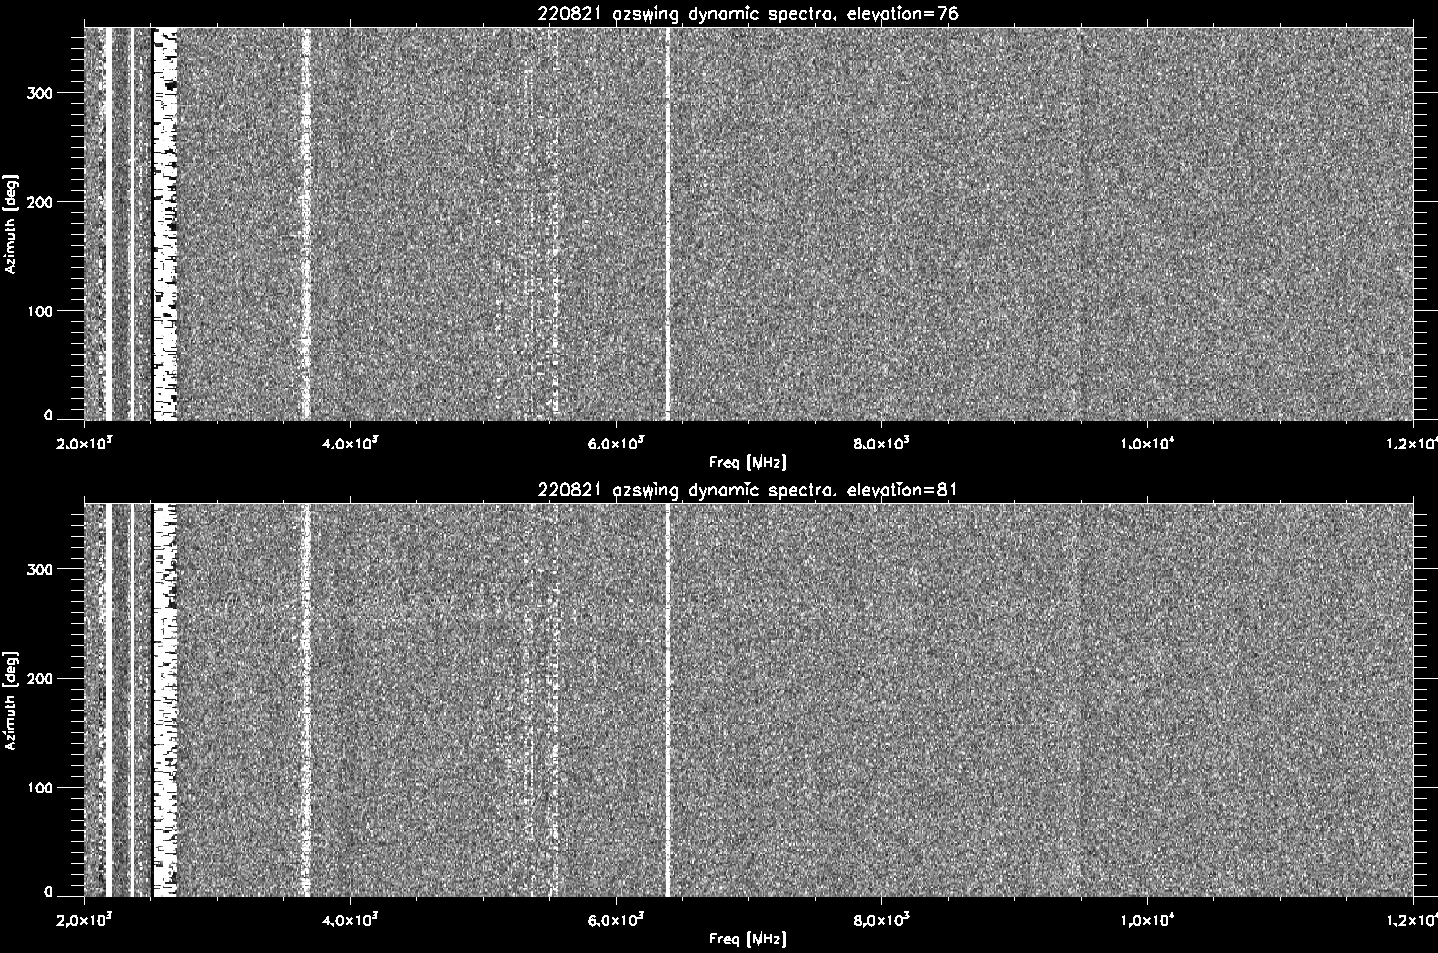
dynamic spectra from the azimuth swings
The table below shows the dynamic spectrum
(spectral density vs azimuth, frequency) from each
azimuth swings
- Each image holds az swings from 2 different elevations
-
Notes on dynamic spectra:
- 2100-2200 rfi .. seen 0 to 360 deg.
- 3550-3700 rfi .. seen 0 to 360 deg.
- 6370-6400
- present az= 0 to 280 deg up to elevation 56deg, then
cover 0 to 360.
Rfi azimuth dependence
The plots shows the azimuth dependence of various
rfi regions seen in the data (.ps) (.pdf)
- The average power around each rfi region was
computed.
- The values from each azimuth swing where then over
plotted.]
-
Page
|
frame
|
freq Range
|
Notes
|
1
|
top
|
2100-2200
|
- constant large level all az
- A few peaks el=6: az=135,200,275
|
bottom
|
2340-2355
|
- constant large level all az
- el=6 peaks at 135,200 az
|
2
|
top |
2500-2700
|
|
| bottom |
3550-3700
|
|
3
|
top |
4695-4705
|
|
| bottom |
5075-5800
|
- u-nni band. az 100 to 200.. (looking at the
transmitters on the mountain range)
|
4
|
top |
6370-6400
|
- az=130. probably microwave link from utuado.
|
processing: x101/220622/plotspc_horn.pro
Plotting the total power vs azimuth
The total power vs azimuth was plotted to see where the lna
might saturate.
- the power at the input the field fox was measured
and plotted.
- The power at the output of the QRFH (by subtracting the
gain of the system) was also plotted.
Total
power vs azimuth showing power levels at input to field
fox (.ps) (
.pdf)
- These plots show the power measured at the input to
the field fox (after the 40db of gain)
- topFrame: 2.8 GHz hiPass filter
- this data was stepped in azimuth and el.
- Each color is data from a different elevation,
- + are data recorded 16jun22, * are data recorded 18jun22
- the largest value was -33.5 dbm around an azimuth of 135
and el=8 deg.
- Middle frame: 2.5 GHz hiPass filter.
- this data was driven continuously in az and stepped in
el
- the computed value was increased by 10db because of the
detector averaging 10 points.
- The maximum value was -12.6dbm at az=275, el=6 degrees.
- Bottom frame: no HiPass filter
- this data was driven continuously in az and stepped in
el
- The maximum power was -1.4 dbm at az=203 and el=6
degrees.
Total
power vs azimuth showing power levels at the output of
the QRFH (.ps) (
.pdf)
- These plots show the power measured at the output of
the QRFH
- Page 1: System Gain:
- Felix measured the s-parameters for the system
(short cable->amp,biasT,cable,biasT,filter).
- S21 (the gain) was then removed from the values that the
field fox measured.
- the 3 colors show the gains for the 3 setups.
- There was 40db gain at the lower freq and fell to
about 30 db at 10GHz.
- Page 2: power levels at horn output vs az,el
- topFrame: 2.8 GHz hiPass filter
- this data was stepped in azimuth and el.
- Each color is data from a different elevation,
- + are data recorded 16jun22, * are data recorded 18
jun22
- the largest value was -72.5 dbm around an azimuth of
135 and el=8 deg.
- Middle frame: 2.5 GHz highPass filter.
- this data was driven continuously in az and stepped in
el
- the computed value was increased by 10db because of
the detector averaging 10 points.
- The maximum value was -62.4 dbm at az=275, el=6
degrees.
- Bottom frame: no HiPass filter
- this data was driven continuously in az and stepped in
el
- The maximum power was -51.4 dbm at az=203 and el=6
degrees.
Summary
The total power vs az,el was measured for
various az,el positions and hipass filter setups.
hiPass filter
|
maxPwr
at fieldfox (dbm)
|
maxPwr
AtHornOutput (dbm)
|
2.8 GHz
|
-33.5
|
-72
|
2.5 GHz
|
-12.6
|
-62.4
|
no filter
|
-1.4
|
-51.1
|
- We did not sample all azimuths so there may be spots a bit
higher
- if the final cooled lna has a 1db compression level of
-35dbm then we could probably get away with no filter.
- If the cooled filter noise contribution is low, we might
think of using the2.5 GHz hipass filter.
processing:
x101/220622/inpazdata.pro,plotazsw_ff.pro,plotazsw_horn.pro