Intro
On 11mar22 the new sband filter was installed
in the postamp chassis in the pedestal. The sband inputs to the
postamp chassis were connected (with no pads at the input). This
allowed us to take data with the sband system without saturating
the sband receiver chain.
On 22mar22 3 azimuth swings were done with
the sband receiver to look at the azimuth dependence of the rfi.
Setup:
- The receiver was set to a center frequency of 2270 MHz
- if/lo attenuators were set to:
- udc: 10,10 db (pola,b)
- if2 : -8,-12 db (8,12db of gain)
- A single mock spectrometer was used to record the data
- 160MHz bw polA,B recorded
- .1 second integration
- 8192 freq channels.
- The power levels were adjusted to a rms of 30 count=1
sigma
- turns out we ended up with about 36 counts since we
were pointed at -90 degrees which had some rfi.
- The telescope pattern was:
- The elevation was kept constant at 30 deg
- the azimuth rate was set to 1deg/second.
- 3 azimuth swings were done:
- swing 1: -100 to 280 deg az CW
- swing 2: 280 to -100 deg az CCW
- swing 3: -100 to 280 deg az CW swing
- datataking started at 13:47
- each swing took 380 seconds
- we finished at 14:07
Processing the data"
- Each azswing was read in with the idl routine
masazswinginp().
- input the file
- select the data between -90 and 270 degrees azimuth
- interpolate the azimuth position to the center of each
.1 second spectra
- the azimuth is recorded once a second.
- add the polA,B spectra together.
- return the spectra in increasing azimuth (so the 3
swings can be easily over plotted).
- generate a dynamic spectra for each azswing.
- each data set had 8192 channels by 3000 spectra.
- these were averaged to generate an image that could be
displayed
- average by 8 in freq and 5 in time ending up with
a 1024 channels by 750 spectra
- 390 Khz freq resolution, .5 sec time resolution (or
.5 deg in az since we moved at 1 deg/sec)
- The spectra were bandpass corrected by dividing by the
median spectra.
- the median power between 2268 and 2315MHz (little
rfi) was computed for each spectra and then each
spectra was divided by this value
- (to remove gain variations and continuum sources)
- Each dynamic spectra was displayed with low and high
sensitivity (to see the location of the strong, weak rfi.
- The rms/mean by frequency channel was computed for each az
swing (3000 spectra).
- larger rms/mean values show channels with rfi.
- The frequency channel with rfi were located and the then
total power was computed within this freq range for each
spectra.
- The rfi total power was then plotted vs azimuth.
- If the rfi repeated at the same azimuth for the 3 az
swings, then this is probably the direction for the rfi.
- A final test was to check to see if we had any compression
in the measured signals.
- the total power in a spectral region with little rfi was
computed and then plotted vs azimuth.
- if we saw a dip in this power then we probably had
compression of the signal.
Looking at the data:
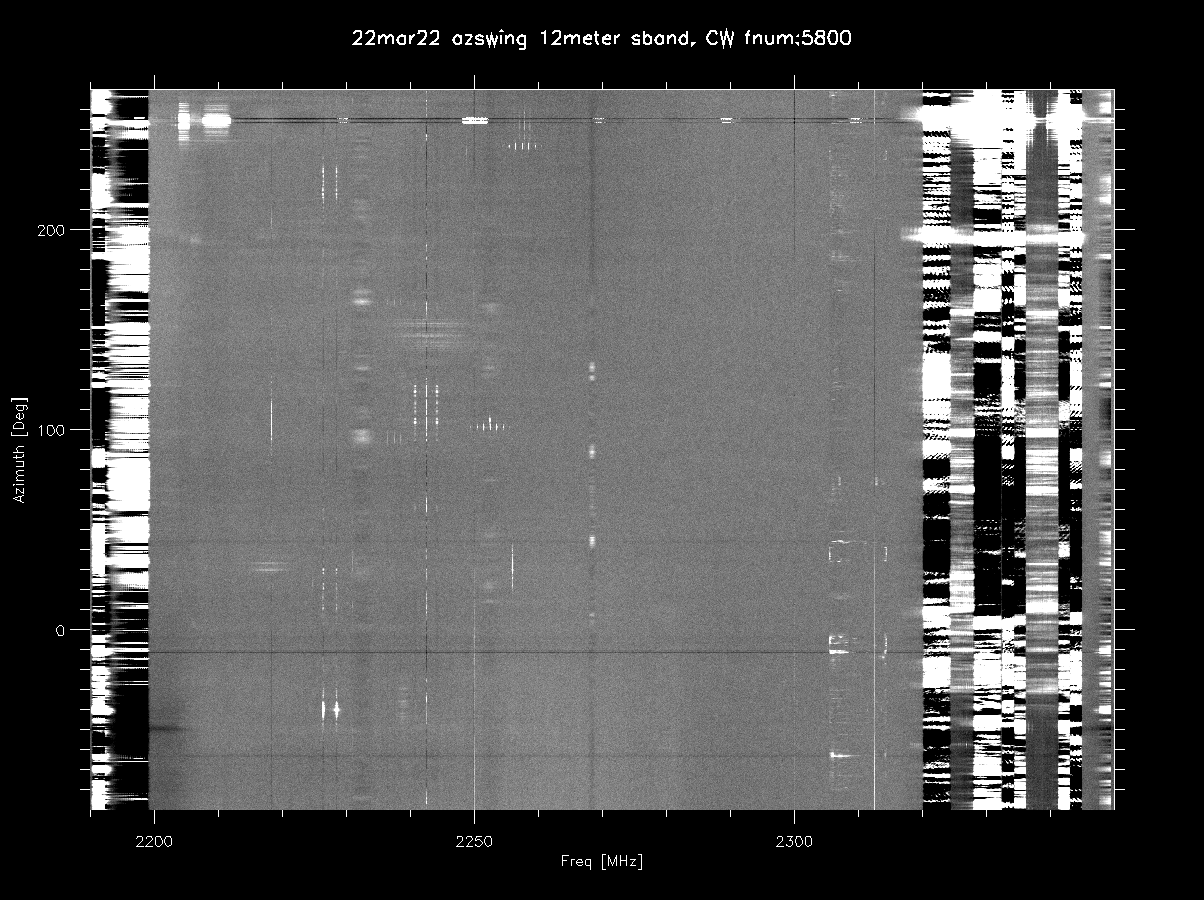
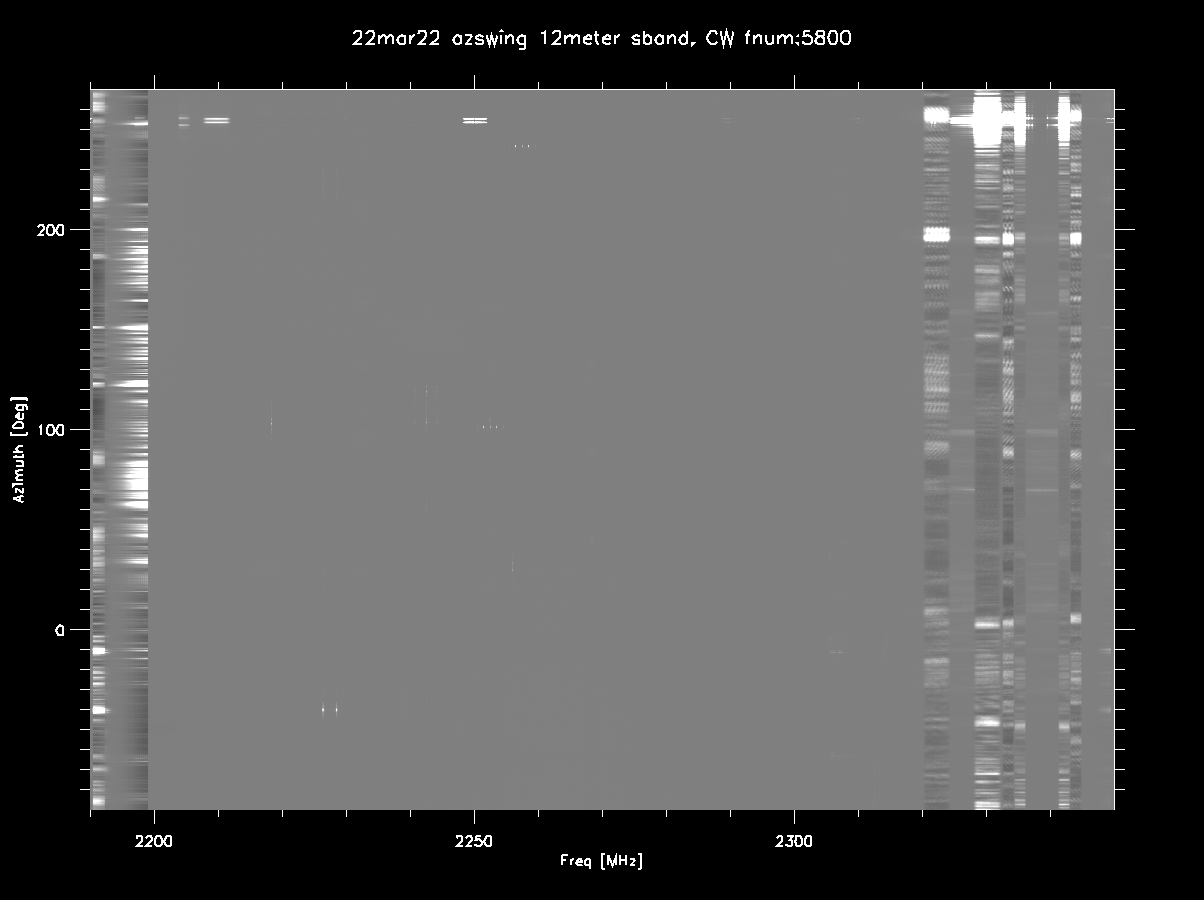
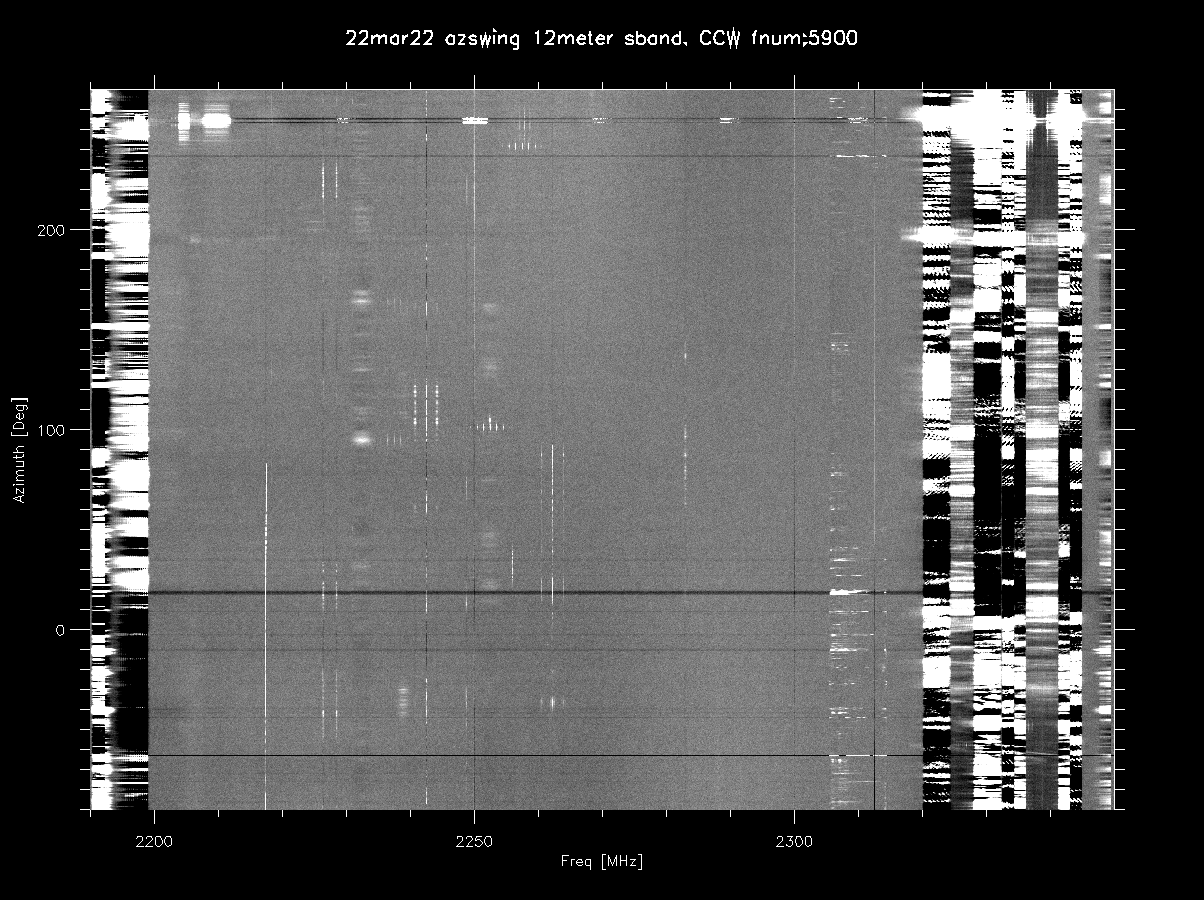
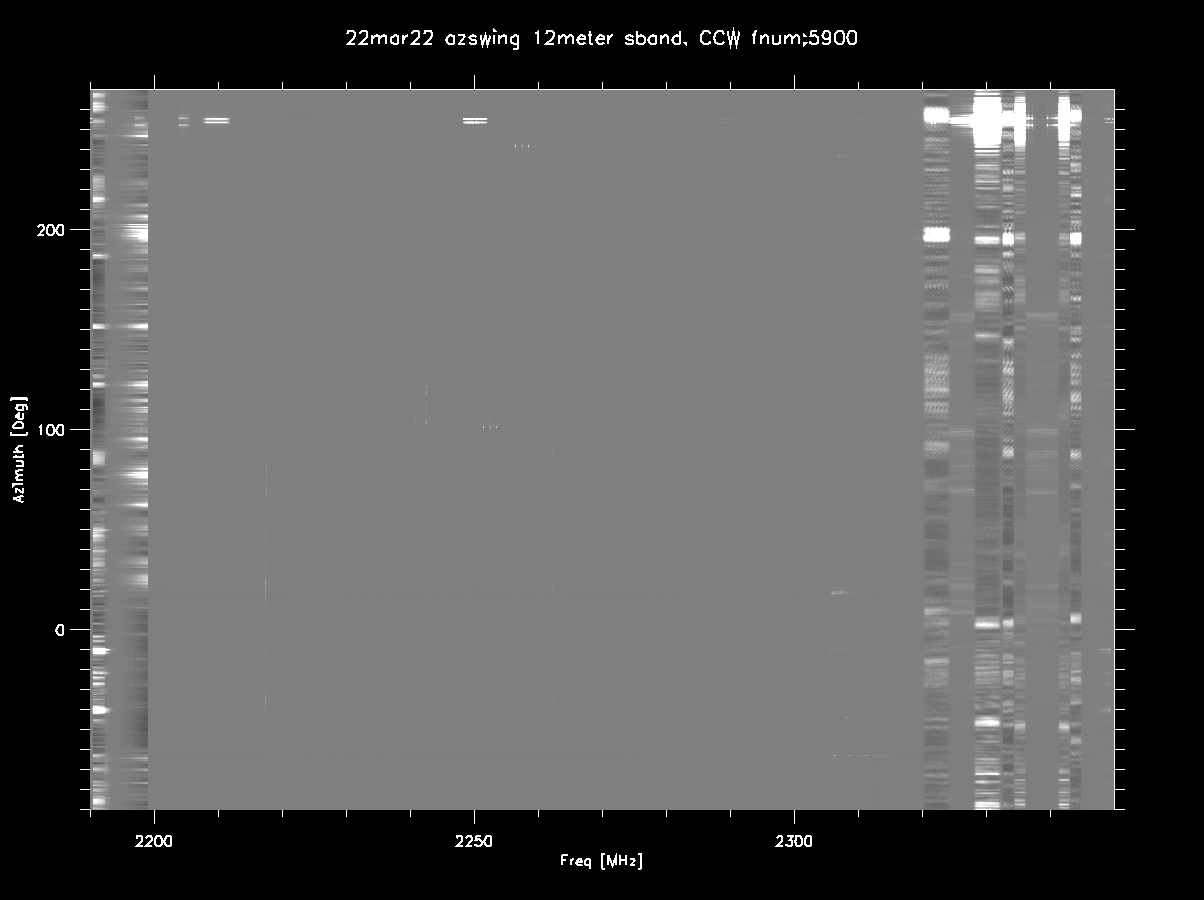
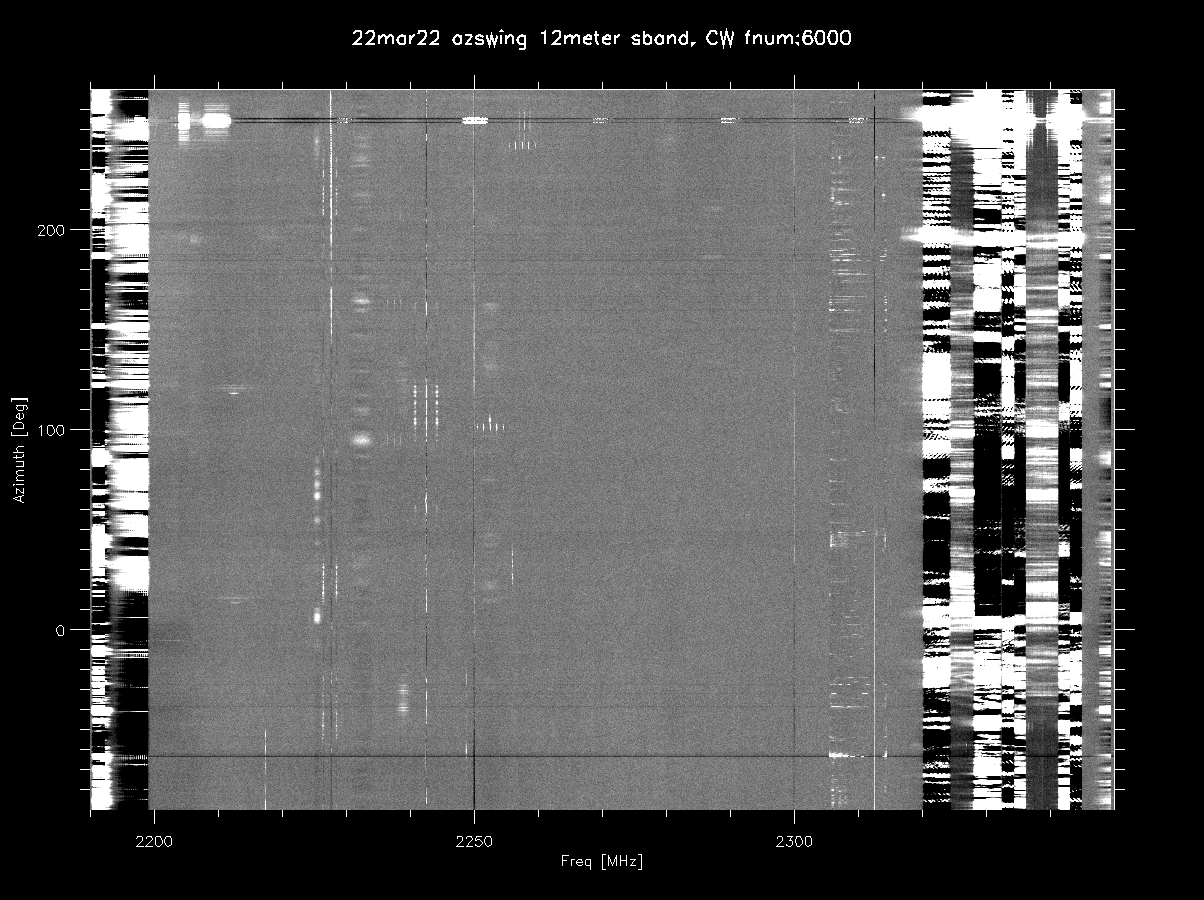
Dynamic spectra
The table below contains the dynamic spectra for the 3
azimuth. For each swing a high and low sensitivity image is
made.
- The rf filter at sband passes 2205 to 2345 (more info)
- The strongest rfi is 2320 -> 2355 (around az=255 and an
azimuth to 195)
- rfi below 2200 is also strong
- you can see a few horizontal black stripes. This is
probably compression/saturation.
- On 11mar22 spectra were measured at the input to the
postamp chassis (before the rf filter)
- This shows the rfi before the filter. The rfi 2100 to
2200 mhz is huge (more
info)
rms/mean and peak hold spectra, saturation.
the plot shows the rms/mean by channel for the
spectra taken in the first azimuth swing (.ps) (.pdf)
- There are two pages of plots.
- page 1 includes all spectra in the azimuth swing
- page 2 excludes spectra where a dark horizontal line was
seen it the dynamic spectra.This is normally caused by
compression/saturation.Plot
- Top: rms/mean by freq channel
- the rms/mean by freq channel was computed using the 3000
spectra of the first azimuth swing.
- Black is polA, red is polB, green is the expected rms
- 19Khz channel width,.1 second integration.
- the non rfi locations are close to the expected
rms/mean.
- the rfi at 2230 has flattened out the rms/mean for pol.
- Page 1:
- The black spikes (a few mhz wide) are not real. They
are being created by the saturation at 2230 MHz.
- Page 2: these black spikes are not seen when saturated
spectra are excluded.
- Bottom: The peak hold spectra for the first azimuth swing.
- The peak value in each freq channel for the first
azimuth swing.
- I've divided by the median value so the vertical units
should be close to Tsys.
- You can see that the 2230 rfi in polA has saturated.
- Page 2 does a better job of showing the rfi (outside the
255 MHz region).
The 2nd plot looks for
saturation of the signal (.ps) (.pdf)
- Top: total power 2272-2280 MHz vs az (using azswing 1)
- this region had little rfi
- Around an azimuth of 255 the level drops by about 4%
probably due to saturation somewhere else in the band
- Bottom: 10 .1 second spectra around az=255 deg
- the signal is saturating at 2330 MHz.
- The vertical scale is mock 32 bit accumulator counts.
- It has hit the limit of 2e9 (largest positive number in
32 bit signed value)
- Looking at the status bits from the mock spectrometer we
also see the polyPhaseFilterbank overflowing with az
250-255.
- the rfi we see spread across dynamic spectra at az=255
is not real. It is being caused by the
saturation/overflow.
- the black 5mhz spike across the peak hold are also
being created by this saturation.
- We don't know if this rfi is saturating. the
analog part.
- The tsys baseline is 1e8
- the rfi is at least 2e9 in 5MHz. the entire band is
130 MHz
- so 5/130 *20 = .8 so this rfi is at least
equaling the normal power out of the filter.
plotting individual rfi birdies vs
azimuth
The plot shows the azimuth dependence of various
birdies (.ps) (.pdf)
- 21 different rfi birdies were selected from the azswing1
dynamic spectra
- the total power was computed, and then plotted vs
azimuth.
- the value from the 3 azimuth swings are over plotted
- black: swing 1, red: swing2, green: swing3
- If the rfi is at a fixed location then is will
probably show up at the same azimuth for each az swing
- assuming it is not too time variable.
- the table below summarizes the results
- Some birdie constant birdies were not include (seen in the
peak hold spectra)
- 2270 -this is the dc component from the mock a/d
converters
- 2250 - this is not seen very clearly in the dynamic
spectra since we bandpass correct with the median spectra.
-
freq
|
az
|
repeats
in az
|
PkVal
tsys
|
Notes
|
2192.9-2199
|
120
|
yes
|
11
|
strongest at az=120, but is
large for the entire swnig
the 3 azswings show the same azimuth dependence.
|
2202.92-2205.31
2207.19-2211.87
2250.77-2254.05
|
255
|
not
real
|
|
these are intermods created in our
system by saturation of the 2330 rfi
|
2217.8-2218.9
|
103
|
no
|
|
very narrow in freq
|
2225.82-2227.
2227-2229 |
-40
|
maybe
all az
|
2
|
strong in first az swing
but seen in the other dynamic spectra, but much
weaker
|
2230.6-2233.6
|
95
|
yes
|
1.2
|
also seen at other az.
|
2338.102239.7
|
-40
|
yes
|
1.1
|
1st swing is a little lower in az.
|
2240.1-2241.24
2242.18-2242.8
2243.6-2244.9
|
102
120
|
yes
|
2max
|
these are 3 narrow spikes in freq
that occur together.
|
2267.2-2268.9
|
-
|
no
|
.5
|
only occurs in azswing 1 at various
azimuths.
|
2305-2308.6
|
-
|
not
real
|
1
|
look like they are coming from rfi
> 2320
|
2312.2-2313.4
|
-
|
-
|
-
|
narrow tone. looks like always
present.
|
2319.2-2324.51
2327-2332
2332.6-2335.9
2336.2-2341.2
2341.3-2344.8
|
255
195
5
|
yes
|
>1000
|
sirius sat1 (4mhz)
sirius sat2 (4mhz)
xm sat1a,sat2a (1.84MHz each)
xm terA (2.53MHz) may just be leakage from adjbands
xm sat2b,sat2b (1.84 Mhzeach)
2327 - 2332 is the strongest > 1000 Tsys.
It is causing intermods in the mock spectrometer.
The other signals are around 2 and 20.
sirius-xm freq allocations (more
info)
|
Summary
- 3 azimuth swings were done from -90 to +270 azimuth at 1
deg/sec
- strong rfi was seen above 2320 MHz around an azimuth of
195 and 255.
- they repeated for all 3 azimuths
- 2320-2324 MHz 5*tsys
- 2327-2332 MHz > 1000*Tsys. saturated the mock
spectrometer
- 2332-2236 MHz about 20*Tsys
- 2336-2341 MHz about 2*Tsys
- 2341-2343 MHz about 200*Tsys
- 2320-2345 is allocated to siriusxm digital radio.
- The sirius satellites are at 85 and 115 degrees west.
these may map to the 12m azimuth's of 195 and 255.
- If we track the satellites, we may get a larger
signal.
- the 2327-2332 rfi (sirius band) caused the mock
spectrometer to saturate the 32 bit power accumulator
- we also so overflows in the butterfly stages of the pfb
- we don't know if the analog system went into
compression.
- Todo: get a tle for the sirius xm satellites and then see
how close we have to be to the satellites to saturate. the
system.
processing: x101/220322/sbazswing.pro