Setup
Taking the data
Computing the fringes
pathdif vs az,el,
fringe rate vs az,el
plots:
dynamic spectra of
abs(ccf)
avg abs(ccf) on,off src,
pklag vs time
Summary
Intro
On 04may16 data was taken on various sources,
using the 305m and 12m telescopes at AO.
This was an attempt to get fringes between the two
telescopes
Setup:
The setup was:
- 305meter:
- xband receiver (circular pol) at 8600 MHz.
- 1st IF 2-12 GHz mixer -> 8.6 GHz -> 1.5 GHz
- 2nd IF 325 MHz (mock input).. used a high side lo
to mix 1500 MHz -> 325 MHz
- The final band was unflipped .. (this is opposite from
the 12meter band).
- Mock spectrometer:
- 16 bit voltage samples
- bandwidth: 5.376 MHz (iq sampling)
- data rate: about 43 MBytes/sec
- 12Meter:
- skyFreq Required: 8600MHz
- mock Spectrometer input IF: 325 MHz
- UDC (updown converter):
- Used 1500 to 2000 MHz vlbi output band.
- Wanted to mix 8600 to 320 MHz (couldn't get to 325
exactly with udc synth resolution).
- lo setting: 7320
- lo equation: 22500 - [ (loSetting*4) -
skyFreq)] - IF1Cfr MHz
- Use 2nd mixer 1820 -> 325 MHz.. lo=2145 MHz
- The UDC returns an unflipped band
- the 2nd mixer had a high side lo, so the final band was
flipped
- --> this is opposite from the 305Meter band
- --> the solution was to reverse the i,q samples
from the 12meter (this flips the band).
- Mock spectrometer.
- same setup as the 305 meter
Taking the data:
Synchronizing the observation starts:
- The mock spectrometers start on a hardware 1 sec tick
(tied to the hydrogen maser).
- The 12meter allowed me to specify a start time
- the 305 meter code (cima) would start a fixed number of
seconds after i pushed the observer button.
- For standard on with no cal requested, it took about 10
seconds from the button push to data start.
- The header for each dataset has the start second. I used
that to lineup the data.
Tracking the sources
- Both telescopes were commanded to track the same source.
- A contiguous data set (scan) lasted for 3 to 6 minutes
- During a scan, i moved the 305 meter telescope on,off
source a few times during the scan.
- for the first 2 scans i only moved off 1 Amin (the 305m
beam is 32 Asecs at 8600).. This was close to the first
sidelobe...
- For the final 3 scans i moved off by 3 arcminutes.
The table below list the scans that were taken
scan
|
src
|
flux
@8600MHz
|
startTm
secs 1970
|
az,el
src
|
offlen
Amin
|
Notes
|
|
|
|
305m
|
12m
|
|
|
|
0
|
J0521+166
|
2.53
|
1462392719
|
1462392720 |
267,71.4
|
1
|
td off, platform
light rain
|
1
|
J0757+099
|
1.08
|
1462393739
|
1462393740 |
117,73.2
|
1
|
rain stopped
|
2
|
J0745+101
|
2.7
|
1462396140
|
1462396140 |
165,81.5
|
3
|
clearing, td active
|
3
|
J0745+101
|
2.7
|
1462396981
|
1462396980 |
187,81.8
|
3
|
|
4
|
J0757+099
|
1.08
|
1462397700
|
1462397700 |
188,81.5
|
3
|
|
Processing the data:
Correcting for the changing path length:
- I did not do any phase rotation to correct for the path
length change as the two telescopes tracked the sources.
- To get an idea how fast the fringes were changing, I wrote
program to compute the path difference for a source entering
the 305m and 12m.
- It only computed to the focus of the telescope
(the extra path length , fiber length was ignored .. since
it shouldn't change too much..)
- The computation was only to get an idea for how
fast the phase difference was changing.. it is not that
accurate.
- The program inputs were:
- the 305m focus (870 feet above the dish) was taken as
the center of the coordinate. 496.868 meters.
- I used google earth to get the distance and angle
between the two telescopes (simple but inaccurate...)
- 12meter:
- .47 km from 305m center at 15.2 deg east of north.
- altitude: 345 meters
- It then created a vector from the 12meter,
perpendicular to the 305m vector pointing at the source.
The point of intersection was the path difference.
The plots show the computed path differences and fringe rates
for the sources used:
- the
path difference for each source (.ps) (.pdf)
- top: path difference vs 305m azimuth (srcaz - 180)
- 2nd: path difference vs lag number ( assuming fiber
lengths are the same)
- .2 usecs is a distance of 60 meters..
- 3rd : path difference vs hour angle
- 4th : lag number vs hour angle
- page 1-4 the 4 source used.
- The fringe rate for each
source (.ps) (.pdf)
- Top frame: fringe rate (cycles/sec) vs 305m az (srcAz
-180)
- bottom Frame: fringe rate (cycles/sec) vs hour angle
- page 1-4 .. the 4 sources
Chris salter recommended a correlation
time of about 25 milliseconds.. A fringe rate of 10 kjhz
would then go thru 90 degs in 1 correlation time.
Looking at the fringe rate plots:
- J0738+177 has a fringe rate of about 30 hz at transit. The
observing time was around transit, so i didn't bother to
observe this source.
Computing the fringes:
- 128K long correlations were done (.024 seconds) between
pairs of polarizations from the two telescopes
- 305PolA x 12mPolA
- 305PolB x 12mPolB
- 305PolA x 12mPolB
- 305PolB x 12mPolA
- i then took the ccf magnitude and accumulated this
for a second of time
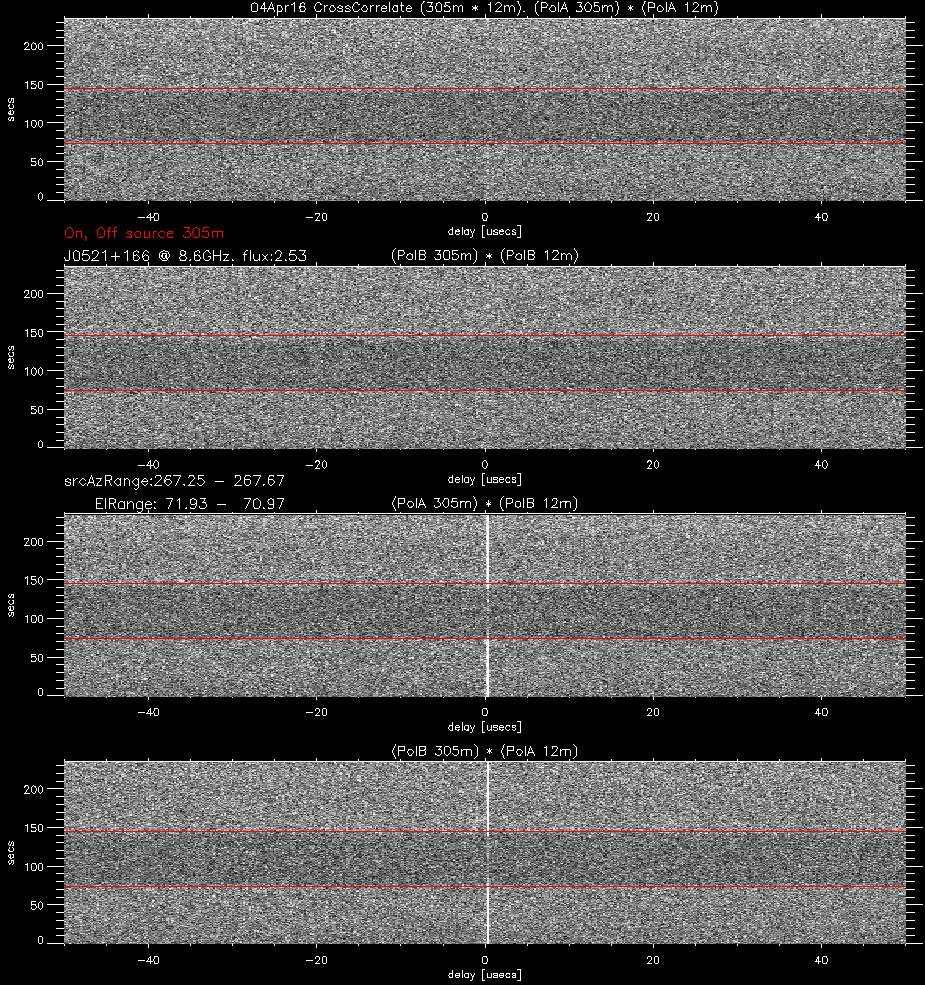
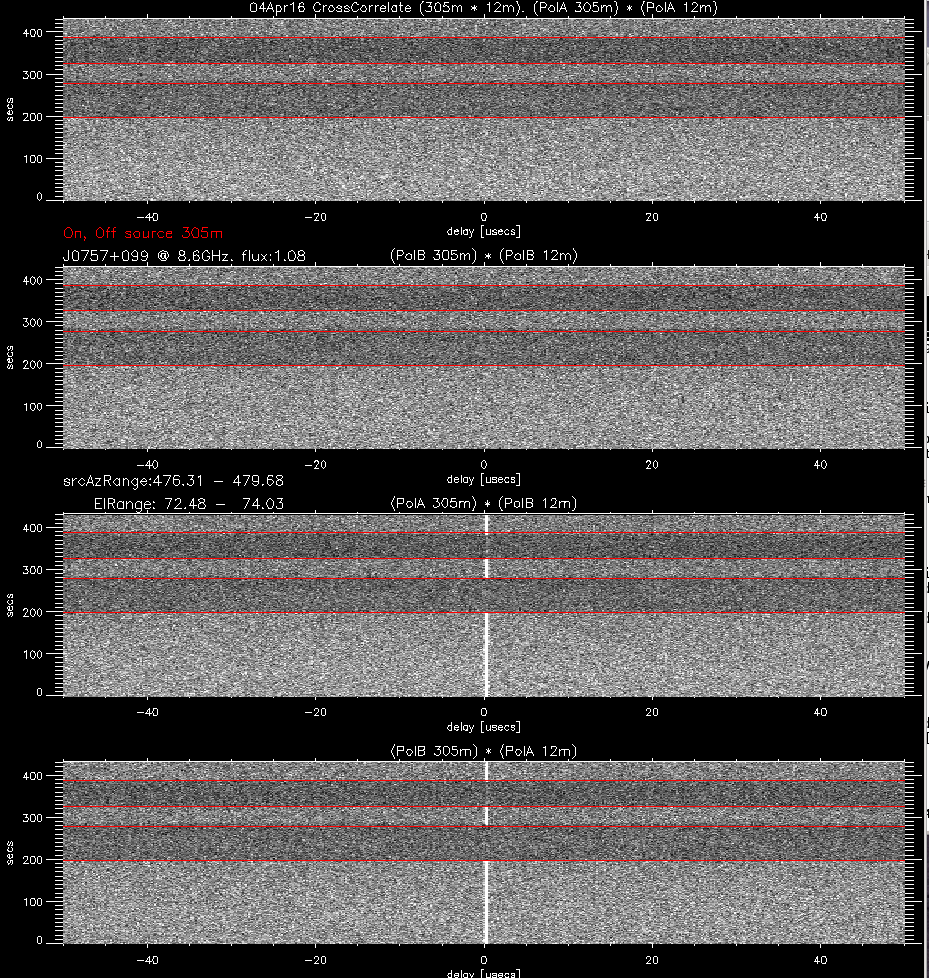
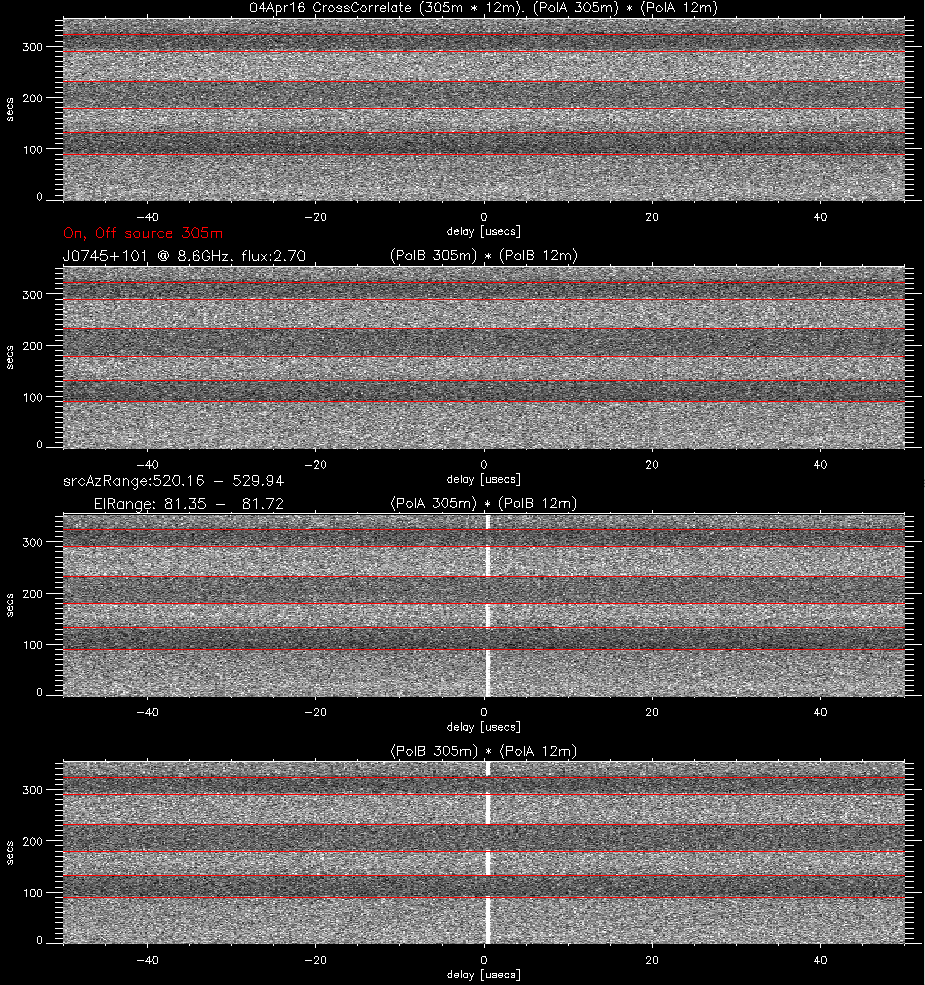
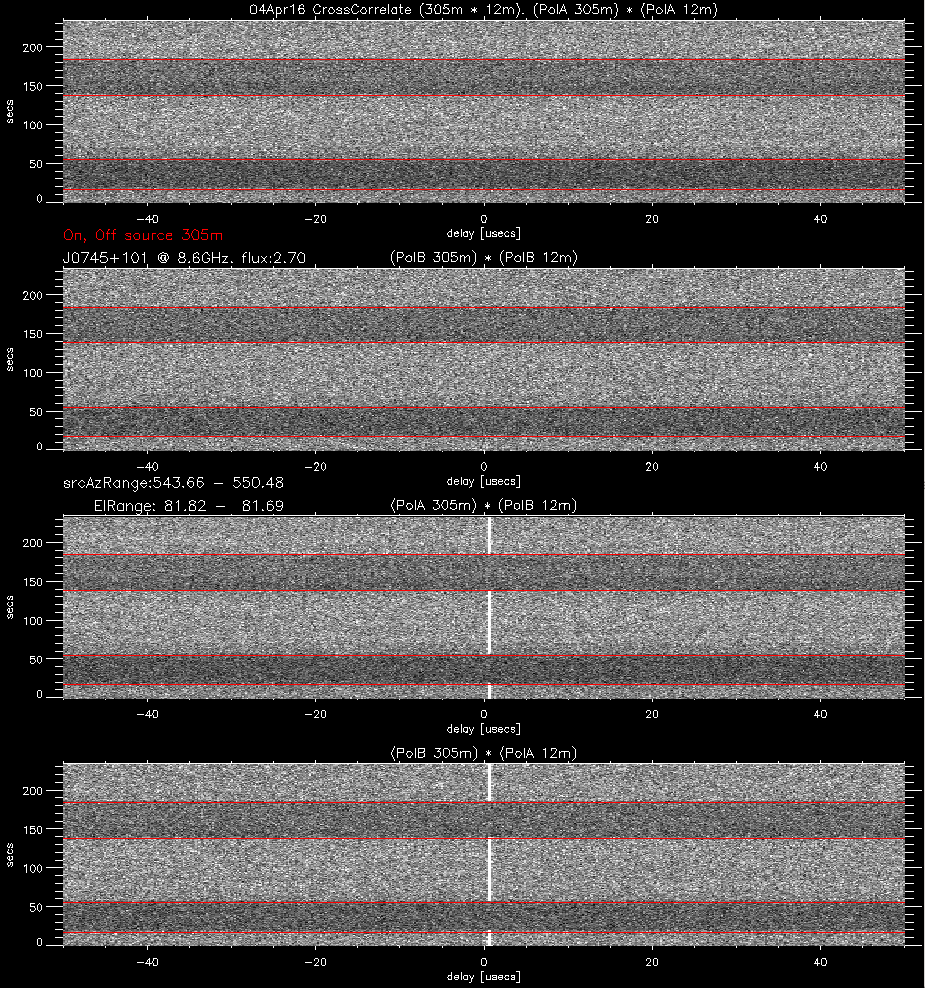
Plotting the results:
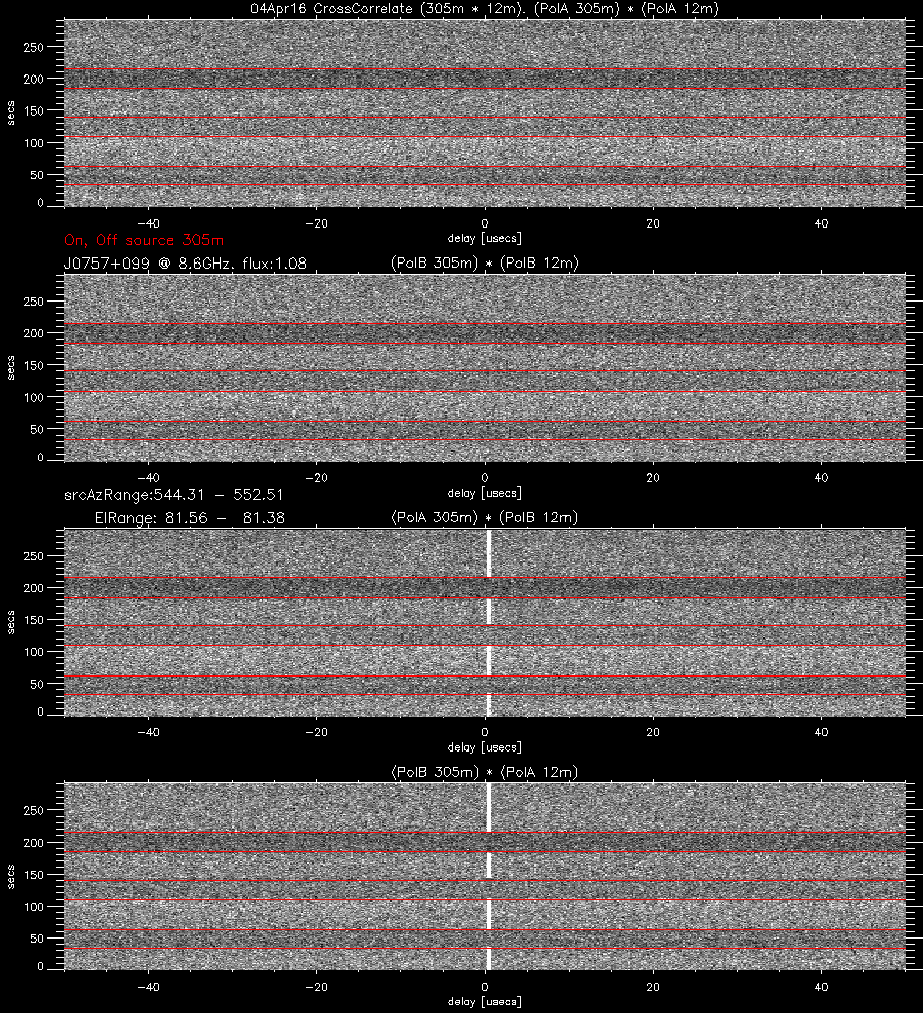
The first set of
images shows dynamic spectra of abs(ccf) vs time:
- each spectra is the abs(ccf) averaged to 1 second
- Each image shows the 4 cross correlations (of the various
pols)
- the red lines show when we went on,off source with the 305
meter
- i normalized each image to the median value.
- You can see the system temperature changing as the 305
meter goes on,off source.
-
- The red lines show when we went on,off source
- The top two frames have no correlation
- so our labeled polA of the 305M corresponds to the
12meter polB labeled cable.
- Note: the 305m has 3 mirrors (reflections), the 12m has
two).
- J0521+166 (3C138) shows some correlation when off source
- the off was only 1amin, so we were close to the first
side lobe (45 asecs).
- For scans 2-4 i went off 3 arcminutes.
Plots of the abs(ccf)
- Page 1: Scan averge of abs(ccf) on source (black)
and off source(red)
- each + is 1 lag (.186 usecs)
- There is probably some smearing from the phase drift
with position.
- Page 2: The peak fringe plotted vs time (1 sec
resolution).
- Red is the peak fringe
- black ane green are the adjacent lags.
- The plot is normalized to the median value of abs(ccf)
for each scan.
Summary:
- The 305m and12m signals were cross correlated at 8600 MHz
(bw:5.376MHz) for 3 different sources.
- lag resolution: .186 Usecs (55 meters in air)
- .024 second ccf, magnitude of ccf averaged to 1
second.
- No phase correction was done to the data to compensate
for the pathlength changing.
- Fringes were seen in all 5 scans that were taken.
- 305M pol Labeled A (left rack) correlates with 12m pol
Labeled B.
- The 305m was moved on,off source during each scan. The
correlation went away when off source.
- A program was written to compute the path difference and
fringe rate.
- It was used to stay away from az,el of sources when
their fringe rate was high.
- I was surprised that the delay was so small..
- I thought the long fibers back from the 12m (.808 km,
ior 1.467.. 3.95 usecs) would give a delay of order usecs.
- I forgot that when the signal passes through the
center of curvature of the 305m, is still has to go 398
meters to get to the horn.