11mar20 repeated measurements over a
portion of the dish
11mar20
Links
the
xy, and yz coverage of the full wedge (.png)
blowup
of the az,el plane shows the az, elevation sampling
(.ps) (.pdf)
The
2nd image shows the x,y sampling of a 2deg x 2deg section of the
green grid area (.png)
plots
show histograms of the radial errors in the grids (.ps)
(.pdf)
averaging
in space and time after removing the mean error from each scan
(.ps) (.pdf)
Intro
As part of the p50 testing we repeatedly
(9 times) scanned a wedge of the dish using the 1 km
scanning mode. We could then compare the 9 scans to see if we
could decrease the rms measurement error by some type of
averaging.
more on 11mar20 p50 scanning
Setup
- The data came from scans 10 thru 18.
- The scanner location was the same as all the scans for the
day, so we could use the locations from scan19 fits for these
scans
- Note: the fits used for the sphere were probably not optimal
for this section of the dish.
- The scanner was set to
- 1km distance mode,
- az 350 to 365 deg (p50 coord sys),
- elevation -30 to 20deg
- 3.1 mm sampling resolution at 10m range.
- high sensitivity mode
- I forgot to record the time for each scan (i don't have the
metadatafiles with the scanner setup).
- looking at the p50 usermanual, a full az scan should have
taken 53m57 seconds.
- our 15 deg az wedge would then be about 2m15 secs. I seem to
remember it took about 4 minutes/wedge so part of that must
have been setup and calibration.
- the scans took about 30 minutes. Data was take from
11:45 to 12:15pm. It was a hot day with high clouds.
Occasionally the sun would break through the clouds for a scan
or 2.
- We were planning on repeating these test at night, but the
people from leica had to leave (after it started raining at
1pm:).
- The scanned area included many points that were not on the
dish (hf dipoles, tiedown cables, etc). A smaller grid of points
was used for the comparison:
- xrange: -6 to 4 meters
- yrange: 60.7 to 86 meter
- These are in the p50 coordinate system.
p50 sampling of the full wedge and
the limited grid.
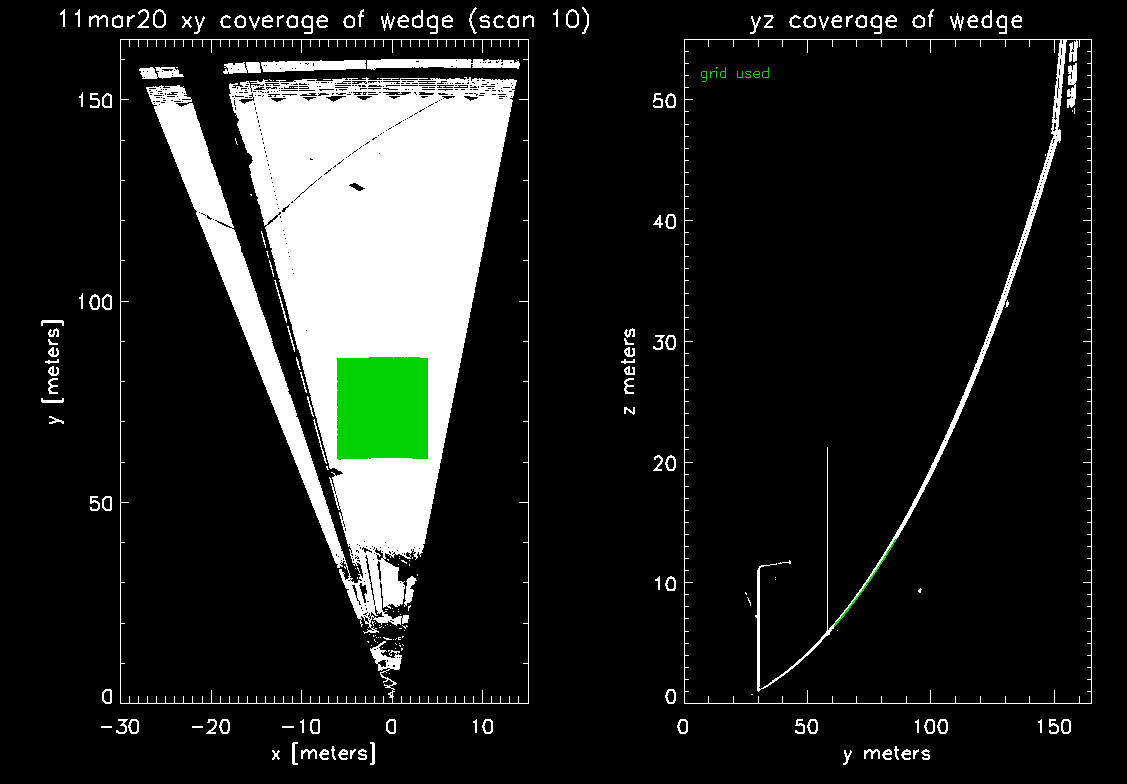
The first image shows the
xy, and yz coverage of the full wedge (.png)
- The left frame shows the x,y coverage of the wedge.
- The green area is the area used for the grid (free of hf
dipoles,etc).
- The right frame plots the y,z coverage of the wedge. The green
area is the grid.
A blowup of the
az,el plane shows the az, elevation sampling (.ps) (.pdf)
- The configured resolution of 3.1 mm at 10m requires
.003/10.= .0177 deg separation in the az,el sampling.
- Top: sampled points for 1 deg az, 20 degs el.
- Each vertical line is an elevation strip from the rotation
of p50 rotating mirror.
- Middle: blowup showing 11 elevation strips.
- You can see the change in azimuth during the strip (since
the az continues to rotate).
- The el rotation was from high el to low el (so az was
increasing).
- The red lines are linear fits to el vs az for each strip (to
get daz/del)
- Bottom: azimuth motion for a 360 deg el rotation.
- The + black line is from the fits to the 11 elevation
strips.
- The az should move .057 degrees for each rotation (if the
az and el velocities were uniform).
- The green line is the measured azimuth difference from the
elevation strips.
- the azimuth is moving .0179 deg/elevation rotation.
- The difference shows that either the az or el angular velocity
is not constant.
- I doubt that the spinning mirror is changing its angular
velocity so the azimuth angular velocity must change.
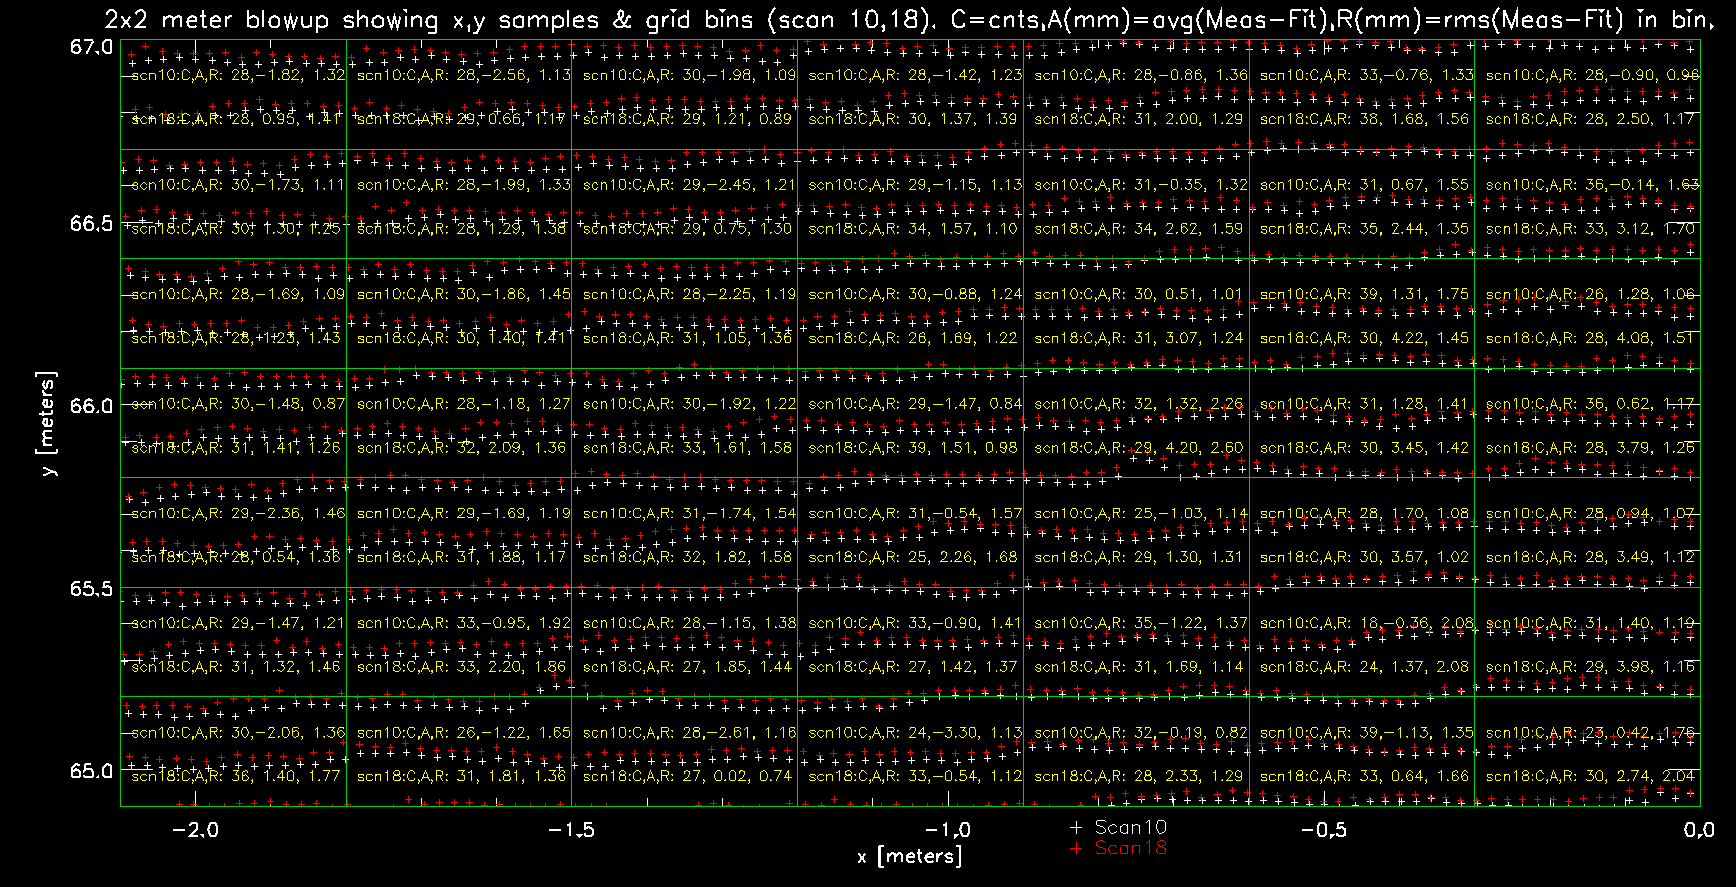
The 2nd image shows
the x,y sampling of a 2deg x 2deg section of the green grid area
(.png)
- The green lines bin the area into .3 meter x .3 meter
rectangles.
- The white + are the x,y samples of scan 10
- The red + are the x,y samples of scan 18 (the last wedge
scan).
- You can see that the sampling for the two scans does not
overlap exactly
- At the 66 meter radius the x (az value) differs by about
3mm, the y sampling varies by about 2 cm.
- It looks like the sampled points are from the echo. If the
dish moved at all during the 9 scans we could expect a change
in the positions (the scans were taken around noon on a cloudy
but warm day).
- The global 4 parameter spherical fit (from scan19) was used to
compute the radial error at each measured point (measured - fit)
- The yellow text shows:
- C: the sample counts in a bin
- A: the average radial error (mm)
- R: the rms of the radial error in the bin (mm)
- The top line in each bin is scan 10, the bottom line is scan
18.
Radial error for the 9 scans.
We want to see if the measurement errors
of the p50 (1.2 +10ppm with 78% albedo out to 270m ) will decrease
if we average over time or over area.
The radial errors were computed using the xyz
position of each point and the 4 parameter fit to as sphere
(x0,y0,z0,radius) done for scan19.
Note that the fit searched for the best sphere that fit the data,
not the best fit to the correct sphere for the AO optics.
The data was limited to the green grid area
for each of the 9 scans.
The first plots show histograms of
the radial errors in the grids (.ps) (.pdf)
- Page 1: histogram of radial errors for scan 10 over the entire
grid
- The red line is a gaussian fit to the histogram
- the mean is -2.15 mm, the rms is 2.79 mm
- (remember this is relative to the best fit sphere, not the
fit to the sphere of AO optics).
- Page 2: the average and rms radial error for each of the 9
scans over the grid.
- Top: mean value of radial error.
- The mean error is changing from -2mm to +1.5 mm over the
30 minute period. This may have been caused by thermal
changes.
- Bottom: the rms radial error for each scan
- it remains relatively constant for the 9 scans at 3mm rms
- (scan 10 rms of 2.9 was larger than the 2.8 mm gauss fit
since the data was a perfect gaussian).
- The scan to scan mean error variation means we can't just
compute the rms for each point between the scans.
- Page 3-5: Try computing the rms over a smaller area (rather
than the entire grid)
- for each scan the grid was broken up into 4 different bin
sizes.
-
bin size (meters)
|
plot
color
|
pnts/bin
|
#bins x
|
# bins y
|
.3 x .3
|
black
|
30
|
32
|
83
|
.6 x .6
|
red
|
120
|
16
|
41
|
.9 x .9
|
green
|
480
|
10
|
27
|
1.2 x 1.2
|
blue
|
1920
|
7
|
20
|
- The dish panel size is about 1 x 2 meters
- For each bin size the rms of each bin was computed for a
scan.
- A histogram was then made of these rms's
- by limiting the bin size we are ignoring spatial variation
in the errors (since the mean value in each bin can vary
without affecting the rms)
- Each frame in the plot is a separate scan.
- You can see that as we decrease the size of the bin, the
rms decreases.
- this shows that part of the errors are caused by
spatial variation in the mean error.
- the dish surface and particularly the fit we're
using does not allow us to use spatial averaging for this
test.
The 2nd plot shows averaging in space
and time after removing the mean error from each scan (.ps)
(.pdf)
- the .3 x .3 m bin size gave histograms with an peak rms
error of about 1.2 mm (this had no averaging)
- To use the average bin error to compute the rms:
- remove the average radial error from each scan.
- compute the rms for each .3 x .3 m bin
- The black lines show the rms computed for each
- Average the radial error over each .3 x .3 m bin
- compute the rms of this avg radial error using the 9 scan
values for each bin
- The red plot shows the histogram of the rms values for the .3
x .3 radial averages.
- Statistically we have averaged about 30 points/bin. This
should decrease the rms by sqrt(30)=5.5
- The actual decrease in the rms was 3.0
- You wouldn't expect the rms decrease to match the sqrt(30)
since we know that the mean error is changing with scan
- we only removed the mean value for each scan. If we had a
linear fit to the mean error vs time,we could have probably
decreased the rms more.
Summary:
- We wanted to show that averaging over time or space would
decrease the measurement error of the p50 to below 1mm
- 9 wedges were measured over about 30 minutes around noon.
- A smaller grid was selected from each wedge (to exclude points
that were not on the dish).
- The mean radial error for each grid showed that the dish was
moving (by about 3mm) over the 30 minutes.
- The rms over different areas of a grid increased as the grid
area increased.
- so we couldn't average over area and expect the rms to
decrease.
- The mean error over the grid was removed from each scan (to
try and minimize the dish motion with time)
- the average error was computed within the .3 x .3 m bin (about
30 points)
- the rms was then computed for each bin over the 9 scans.
- The histogram of the rms decreased from 1.2 mm to .4 mm
- The expected decrease was sqrt(30) = 5.5 . we got 3.0
- The motion of the dish is probably still limiting the rms
decrease (since we only removed the mean value of each scan)
- Averaging 30 points allowed us to get to an rms below 1mm.
- This test was done at a distance of 66 meters. 150
meters may require averaging larger areas.
- this should be possible if we limit the measurements to
nighttime when the dish is thermally stable.
- The p50 looks like it can be used to measure the primary and
get below 1mm rms measurement error.
processing:
x101/p50/200311/wedge/dowedge.pro
<-
page up
home_~phil