Links:
intro
setup
processing
azswing spectra
Plots/images
Total power
measurements
Plots
Summary
INTRO
on 17may23 the field fox spectrum analyzer
was placed at the output of the filter box. 16 azimuth swings
were done at elevations 6 -> 81 deg in 5 deg elevations
steps. This data will give an idea for how strong the rfi is and
if the lna goes into saturation.
Notes:
- lna 1db compression = -35dbm
- +48db gain from lna input to filter box output
Setup:
- The field fox setup was:
- span 2 to 12 GHz
- rbw - 1Mhz
- 1001 points.
- the detector was set to average the 10 samples for
each output point.
- The spectra showed the 1mhz rbw output
- the total power plots summed the 1001 points and then
multiplied by 10 (since 1001*1mhzRbw is only 1 GHz )
- preamp off, attenuator=0,detector=average.
- single sweeps were taken and then read back as the
azimuth was moving.
- It took about 6 seconds for a single sweep and readback.
- The azimuth swings went from -90 to +270 deg az.
- The telescope was driven at .2 deg/sec
- the 6 second spectra gave azimuth samples every
.2deg/sec * 6sec/spc = 1.2 deg /spc
- It took 360/.2=1800 secs (20minutes) for each az swing
- the 16 azswings took about 5 hours.
- data was taken from 17: to 24 hours ast.
- The tcl script used for datataking:
usr/p12/wbrcv/azsw_230517.tcl
- The output spectra went to : /share/phildat/wbrcv/230517/
- data file names: azsw_00_el_nnn_az.dat
- were el is 06,11,..81
- nn=0..215
- az=006,011,...086
- The signal path was:
- dewar -> 36" cable -> filterBox-> 12'cable
-> fieldFox spectrum analyzer.
- When computing the values removed the 7.3 db loss of the
12' cable before the field fox.
Processing the data:
Spectra were recorded every 6 seconds or
1.2 deg in azimuth giving 300 spectra.
The input spectral data was then interpolated to 1. deg
spacing grid (giving 360 spectra all measured at the same
azimuth position).
When computing total power, the sum of the
1001 channels were taken and then multiplied by 10 (since
1001*1Mhzrbw is only 1 GHz)
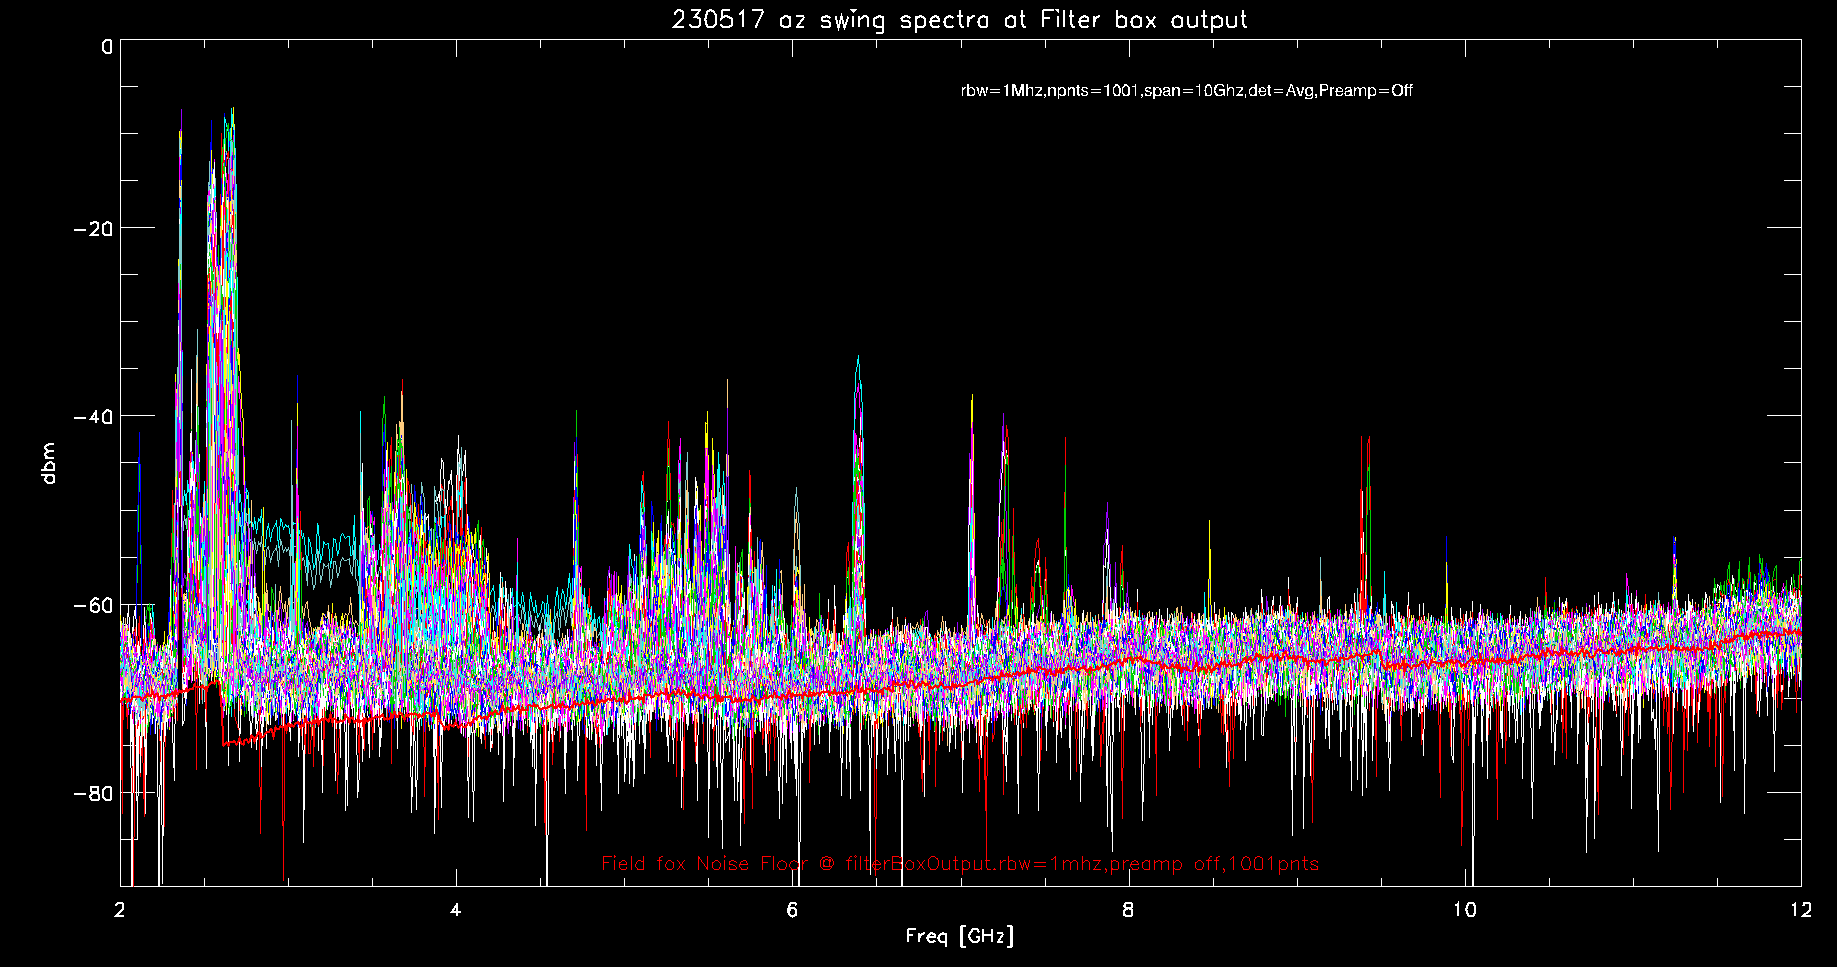
Plotting the spectra
The first
image over plots all of the spectra for
all of the azimuth swings (.png)
- the 360*16 spectra are over plotted. The vertical scale is
dbm at the filter box output.
- the thick red line is the field fox noise floor (moved to
the output of the filter box).
- I had to use an image, since a line plot would be too
large.
- largest peak value in 1Mhz rbw is -8dbm
- This would be -8dbm-48dbgain=-56dbm at the lna input.
- the lna 1db compression is -35dbm (but this is not the
total power, just the 1mhz rbw max).
- processing: x101/230517/plotazsw_tp.pro
The 2nd plot has spectra averaged/peakHeld for
each az swing (.ps) (.pdf)
- For each azimuth swing, the average and peak hold over the
360 azswing spectra are computed.
- the top frame has the peak hold spectra for each az swing
- the bottom frame has the average spectra for each az swing
- The spectra and field fox noise floor have been moved to
the filter box output (removed 7.3 db cableloss).
- Each color is a different elevation ( i had to repeat the
colors starting at el=56)
- The thick read line is the field fox noise floor
(average).
- The first page shows 2 to 12 GHz
- The following pages show spectra in 1GHz steps.
- Page 1: All frequencies
- The strongest rfi is the 2350 rfi
- Page 2 - 11 2-3GHz . to 11-12GHz
- Above 6GHz the noise floor is being set by the field fox.
- processing: x101/230517/plotazsw_spc.pro
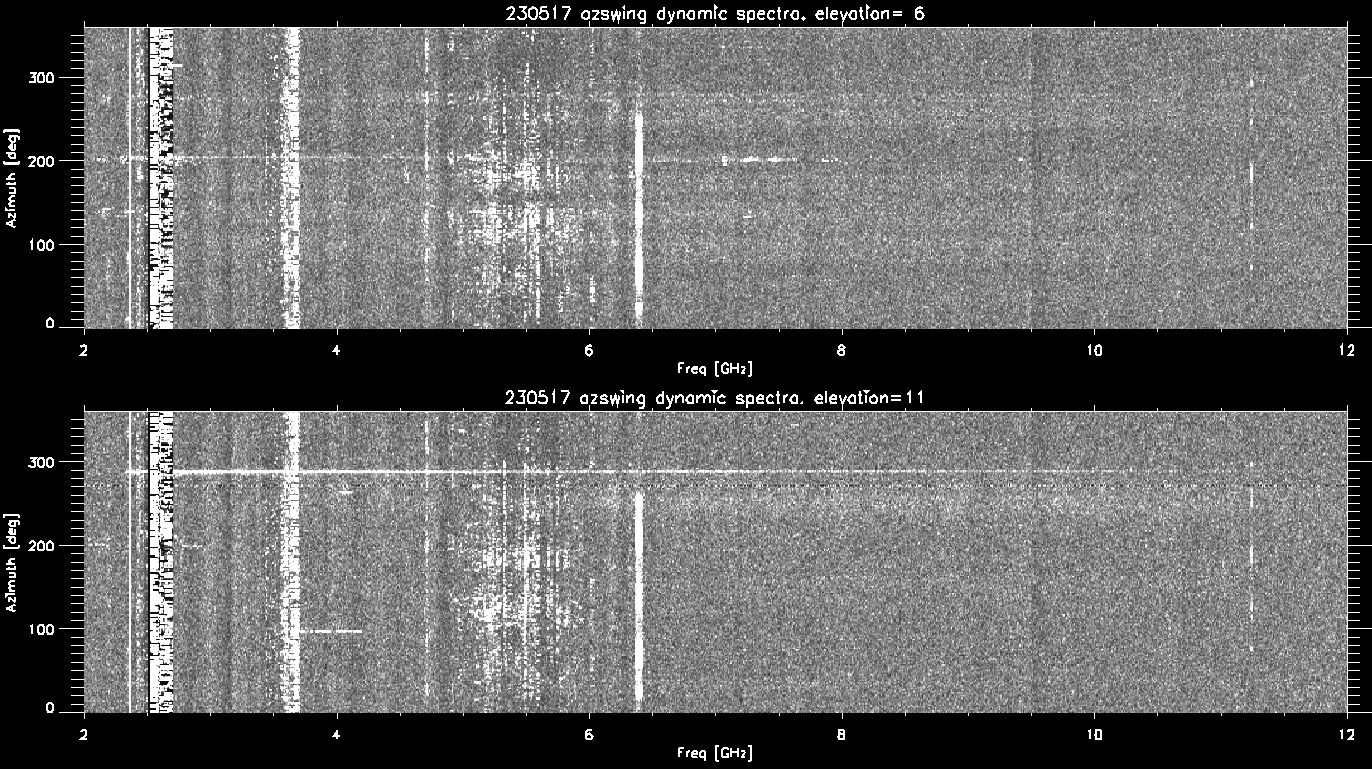
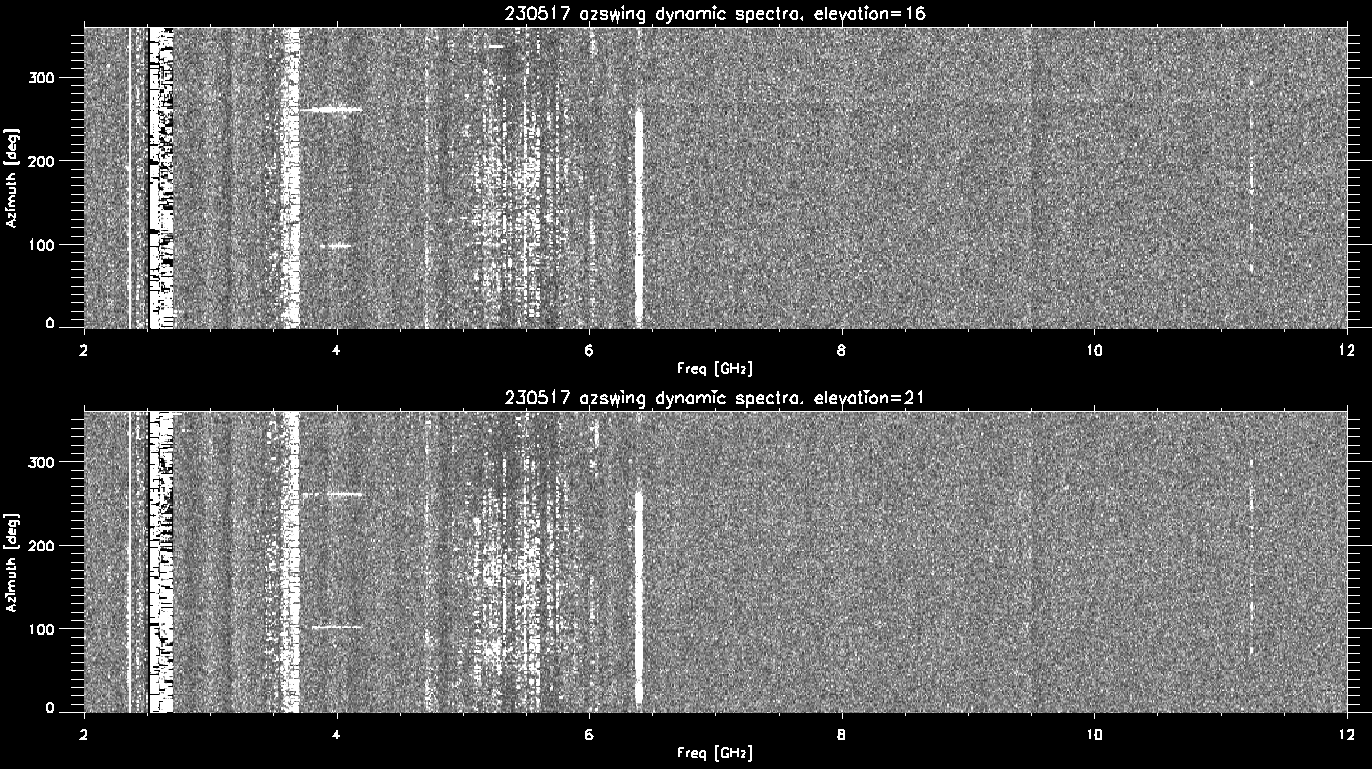
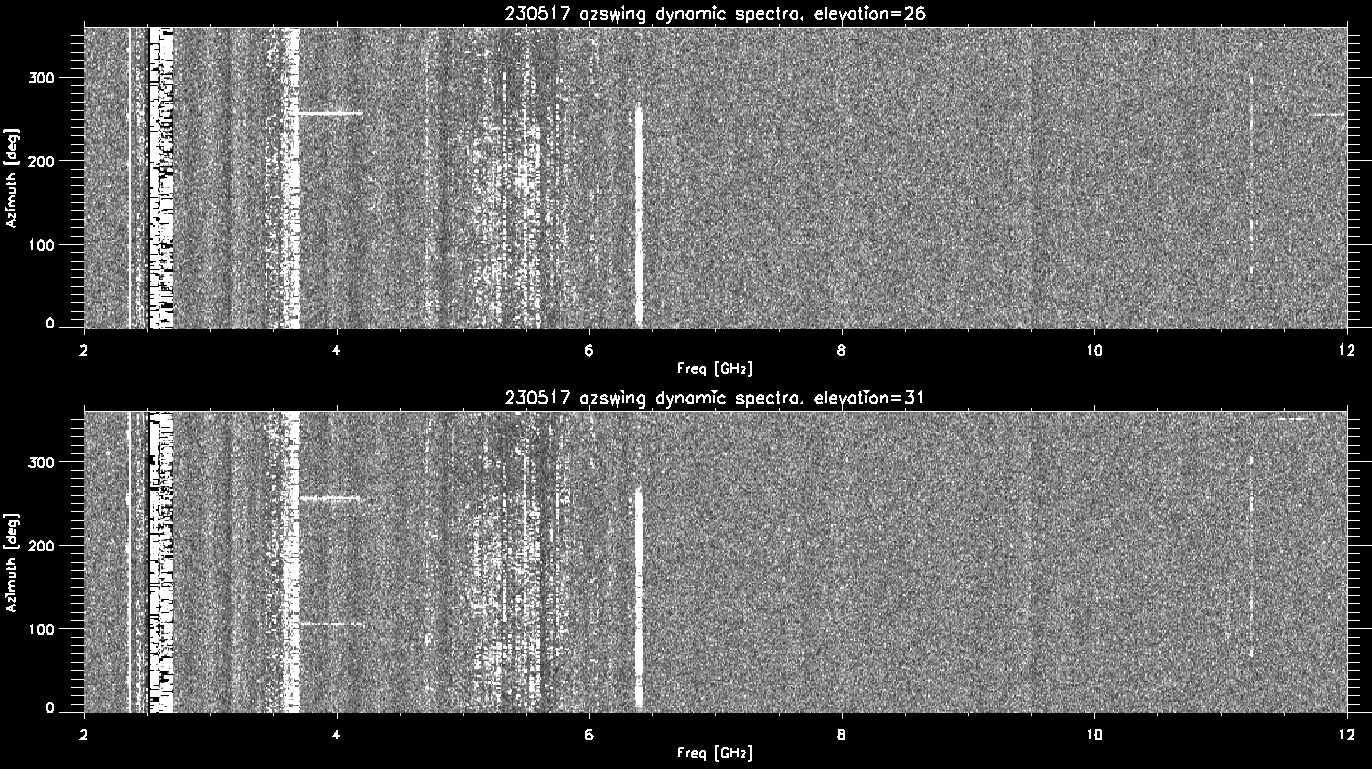
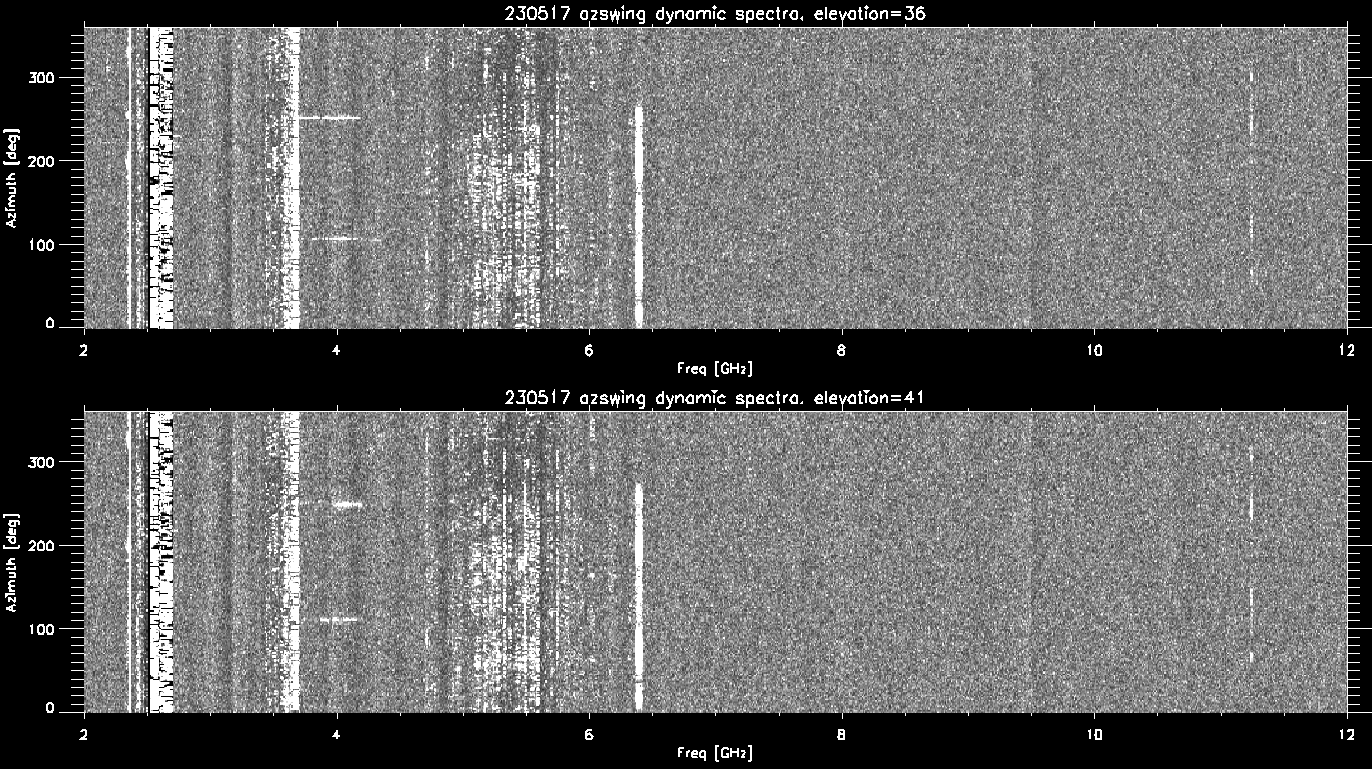
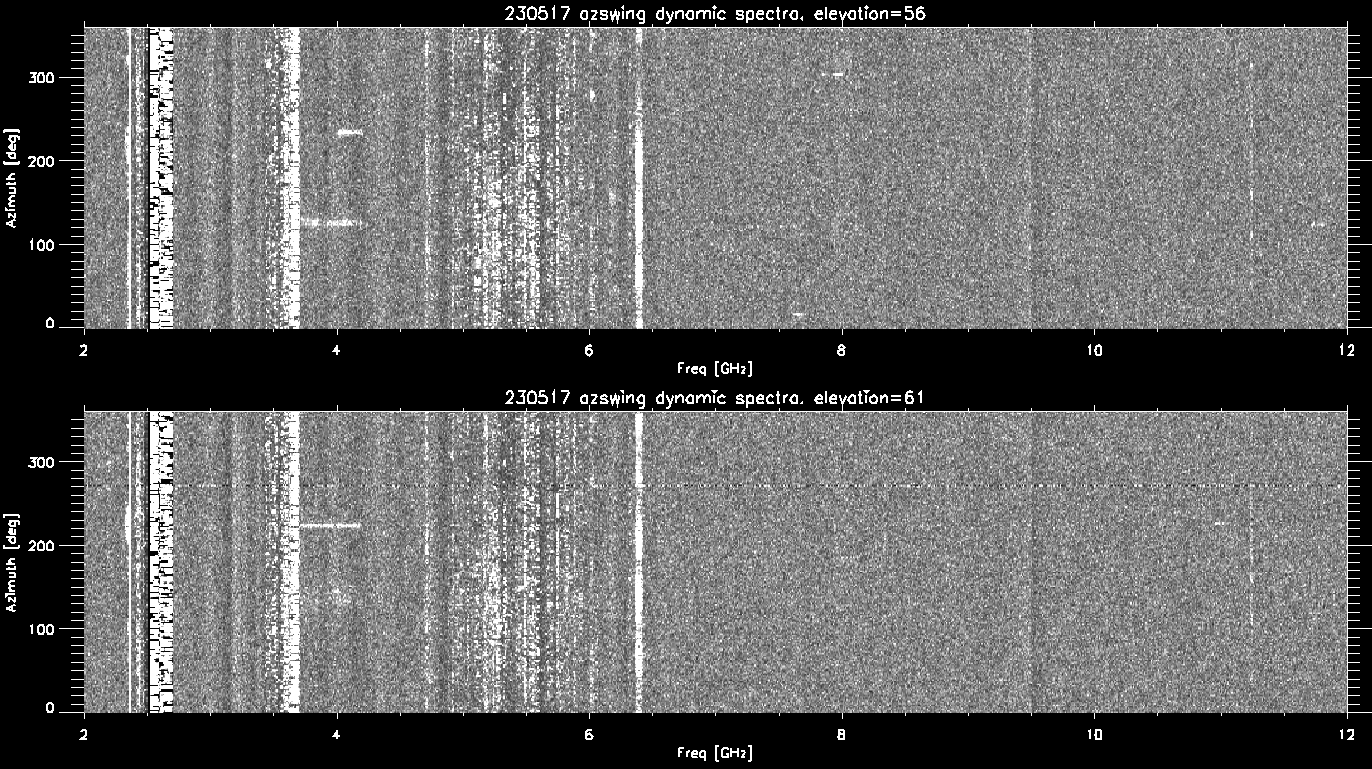
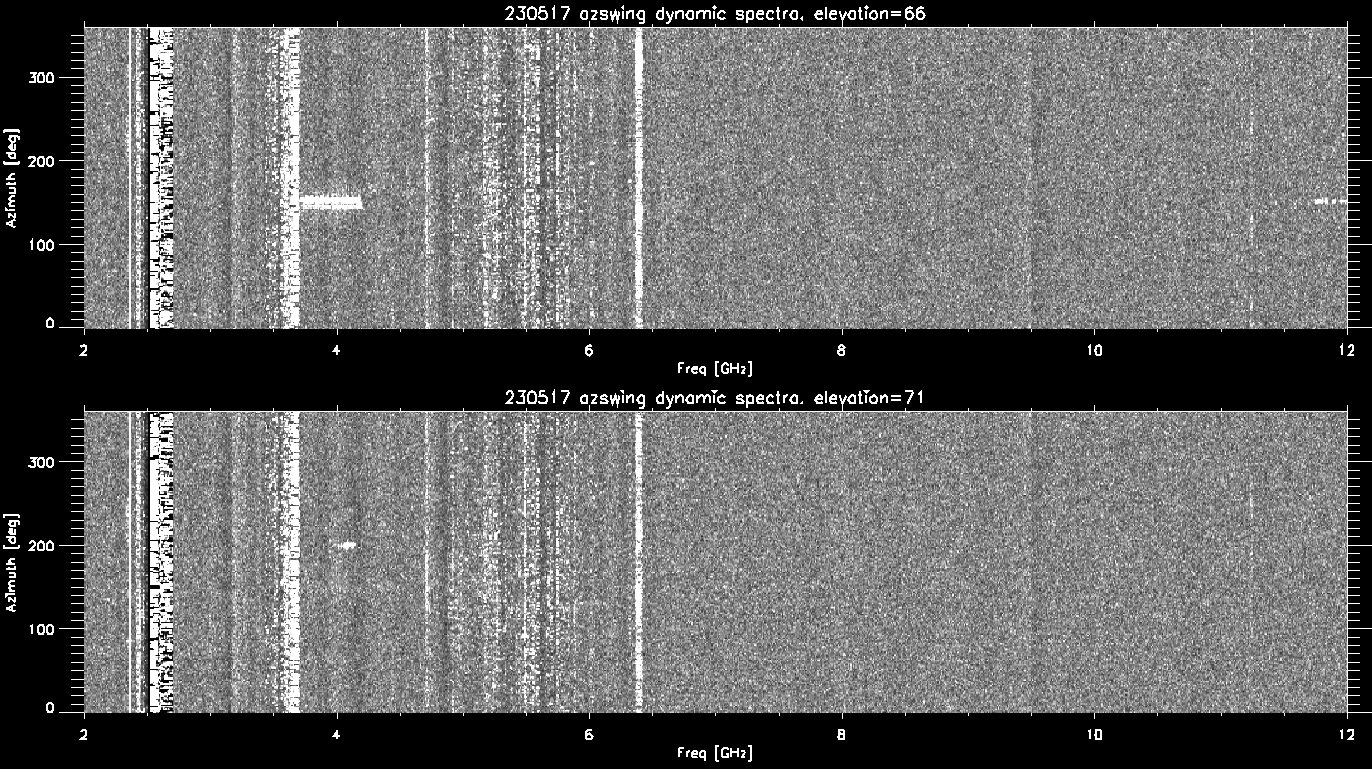
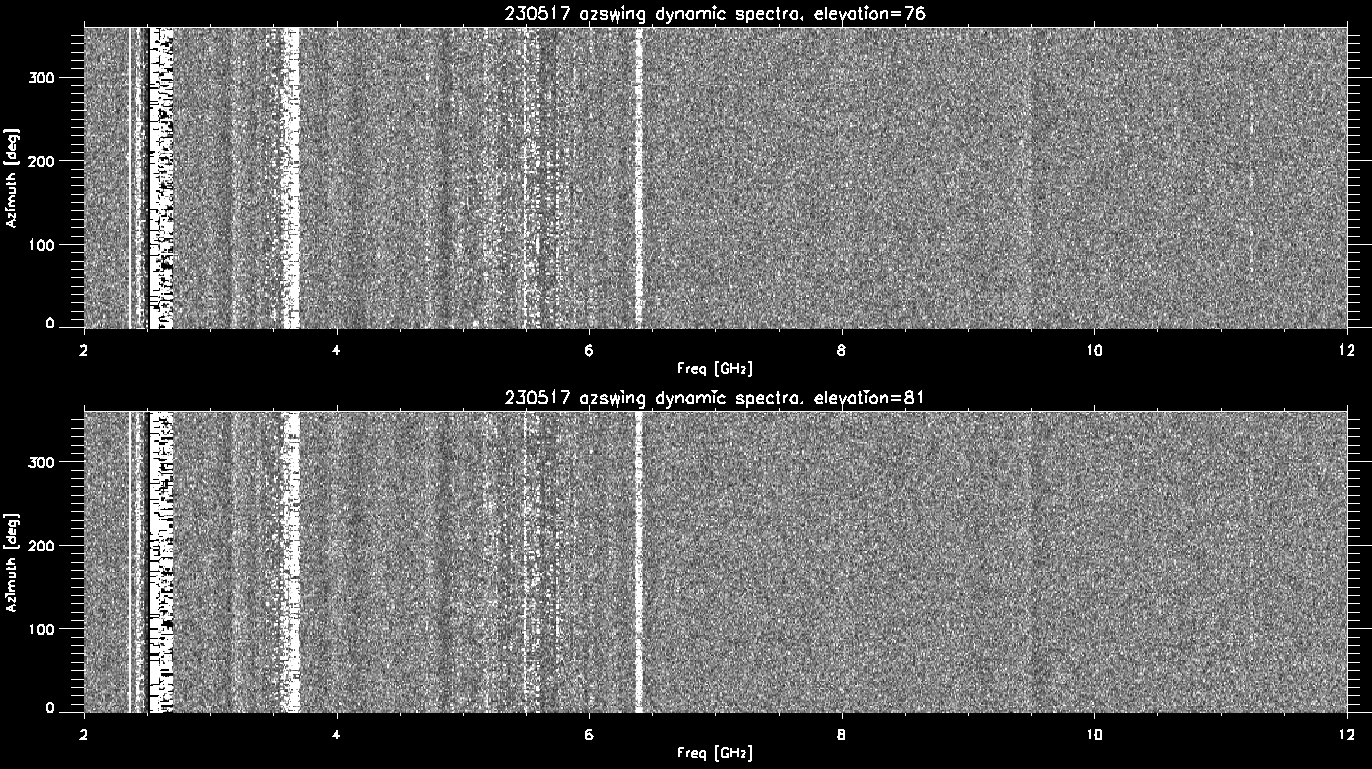
The table below has dynamic
spectra for each azimuth swing.
- the images were scaled to +/- 3sigma
- You can get an idea for the azimuth,elevation
dependence of the rfi
-
Azimuth swing total power.
The total power was computed from the
measured 6 second single sweep spectra.
- The 1001 spectral points covering 2GHz to 12GHz were
averaged (linearly) and then 10db was added to correct for
having 1001x1mhz rbw points.
- this was done for each of the 360 1deg points of each
azimuth swing.
- Plots were then made for:
- filter box output (measured data)
- lnaInp .. subtrace 48db gain from measured value
- foTxinp with no 15db straight thru pad and no 12db
pad before foTx
- foTxInp with 15db pad for straight thru
- foTxInp with
The first plots show the total power vs azimuth for the
various elevations (.ps) (.pdf)
- plots were made the the power reference at:
- filterbox output, lnaInput, FiberOpticTx inp with
various pads inserted in the system.
- The plots will show how close we are to the 1db
compression for straight thru mode.
- Each frame
- has the total power vs azimuth for the 360 measured
points..
- 4 azswings at different elevations are plotted in
different colors
- Page 1: total power (at filter box output) vs az for
elevations 6..81
- The maximum value is az=200, el=6degs of about +8dbm.
- Page 2: shows the same data moved to the lna input (48 db
has been removed)
- The lna input 1db compression is at -35dbm
- The peak value is about 5 db below this so it may be
slightly compressed.
- The typical value is below -50 dbm.. so there is about
15 db to the 1dbm compression
- Page 3: FiberOptic Tx input. No 15db straight thru pad, no
12db pad before the FoTx
- the FoTx 1db compression at input is 10dbm
- the level is at least 20 dbm.
- total power measurements at the foTx coupler measured
+23dbm. So the computed value are close.
- Page 4: FiberOptic Tx input with 15db pad in straight thru
filter.
- The typical value is around 10dbm.. the foTx 1d
compression.
- When we measured the power using a power meter at the
FoTx coupler we got +10db going into the fiber optics...
- So the computed value matches the measured value.
- so the 15db straight thru pad is not enough to keep the
system out of saturation.
- Page 5: FiberOptic tx input with 15db pad for the straight
thru filter and a 12db pad in front of the foTxInp.
- The typical value is about -5dbm. This is 15db
below the 1db compression of the fiber optics.
- using the power meter at the fotx coupler, we measured
-2dbm at az=90,el=6. This is very close to the az=90,el=6
computed value.
processing: x101/230517/plotazsw_tp.pro
The 2nd set of plots shows totpwr azimuth dependence for
some strong rfi (.ps) (.pdf)
- The power is at the output of the filter box.
- Each color is a different azimuth swing.
- each frame over plots the total power for the listed freq
range for all az swings.
- Page 1:
- 2340-2355 Mhz
- 2400-2500 Mhz ism band
- Page 2:
- 2500-2700 Mhz
- pk az=200deg, el=6, but strong at all az
- 3400-3550 Mhz
- Page 3:
- 3550-3700 Mhz 5G
- 4695-4705 Mhz
- page 4:
- 5075-5600 Mhz U-NII band
- 6370-6400 Mhz
- pk az=135,el=6.. but smaller peaks at az=20,70,200,250
- Page 5
processing: x101/230517/plotazsw_spc.pro
Summary
- On the sky the largest 1Mhz rbw peak was:
- -8db filter box output
- -56dbm at the lna inpuit
- The strongest rfi is the 2340-2355 Mhz rfi
- The warm
receiver test with the warm 2.5GHz hipass filter
- (look at the 2.5 GHz hipass plots)
- 2340-2355 rfi =-42 dbm in 1Mhz rbw
- 2400-2500 rfi = -28 dbm in 1Mhz rbw
- The cooled 2.5 GHz hipass filter :
- 2340-2355 rfi same level as the 2400-2500 Mhz rfi
- --> The cooled 2.5 GHz hipass filter in the dewar is
not performing as well cooled.
- The 6-7 GHz rfi is strongest at el=6 deg. probably
microwave links.
- The maximum lna input power is -40dbm at az=200,el=6 and
az=220, el=36 deg.
- lna input 1db compression is -35 dbm. so this rfi may be
close to starting to compress.
- The typical value is below -50 dbm.. so there is about
15 db to the 1dbm compression
- The fiber optic Tx input being fed by straight thru mode
in the filterbank:
- with no straight thru pad, and no 12db pad:
- > 20dbm .. well above the 10dbm 1db compression
- 15 db pad in filter bank straight thru:
- about 10dbm.. so at the 1db compression of the foTx
- 15db pad and 12 db pad in front of fotx
- typically -5dbm.. so it is 15 db below the 1db
compression.l
- computing the total power at the FoTxInput from the
measured filterbox output gives values that match what we
measured when we used the power meter at the foTx coupler.
- We could probably compute the foTx input values
for various filters by summing the freq of the filter.
- Later measurements showed that the 12db pad in front of
the FoTx input negatively inpacts Tsys for the higher
frequencies.